A Comparative Study of Selected State-owned and Private Commercial Banks
Dr. Md. Ariful Islam
Hakkani Publishers
Publication Information
Hakkani Publishers
Published by
Golam Mustafa of Hakkani Publishers
House-7 Road-4 Dhanmondi Dhaka-1205
Phones: (+8802) 9661141
Call: (+88) 01811 416026, 01811 416027
E-mail: info@hakkanipublishers.com
E-commerce: www.paramabooks.com
Web: www.hakkanipublishers.com
Copyright @ Author
First Published: 15 May, 2022
Cover Design & Illustration:
Md. Ebrahim Bappy
Sales Center
Popular Publishers
20 Pyari Das Road Banglabazar Dhaka
Printed by
Faria Printers
Khans Mansion
215/A, Fakirapool (1st Lane)
Motijheel, Dhaka-1000
Price: TK 1000.00
All rights reserved. No part of this publication can be reproduced or transmitted in any form or by any means electronic or mechanical, including photocopy, recording, or any information storage and retrieval system now known or to be invented, without the permission in writing from the publisher.
ISBN: 984-70214-0179-6
Dedication
Dedication
To My Family, Friends and Teachers
with
About the Author
About the Author
Dr. Md. Ariful Islam
Dr. Md. Ariful Islam has been an experienced and successful corporate banking professional in Bangladesh for about fifteen years. His professional and academic diligence is remarkable and is now evident in his multidisciplinary works.
Dr. Ariful has been awarded his Doctor of Business Administration (DBA) degree in the Banking & Insurence Department from the Faculty of Business Studies, University of Dhaka in 2019 under the research topic of “A Comparative Study on Non-performing Loans of Selected State-owned and Private Commercial Banks in Bangladesh”. His DBA research analyzed the effects of various economic and bank-specific variables on “Non-performing Loans” in the banking sector of Bangladesh. It has also investigated the root causes of non-performing loans both in the short and long run. The research also presents the effects of excessive credit growth on the long run credit quality, the effects of cost of fund on non-performing loans along with the field survey analysis in finding the root causes of deterioration of loan quality. In addition, he has published several peer-reviewed articles in reputed national and international journals. He also worked as a research assistant in several significant data-driven economic research projects.
Dr. Ariful completed his bachelor’s (BBA) degree with a major in finance from the University of Dhaka in 2004. He obtained his master’s degree (MBA) in banking from the University of Dhaka in 2005. He also holds MBM and LLB degree. He is also a guest faculty at the University of Dhaka, Bangladesh.
Preface
Preface
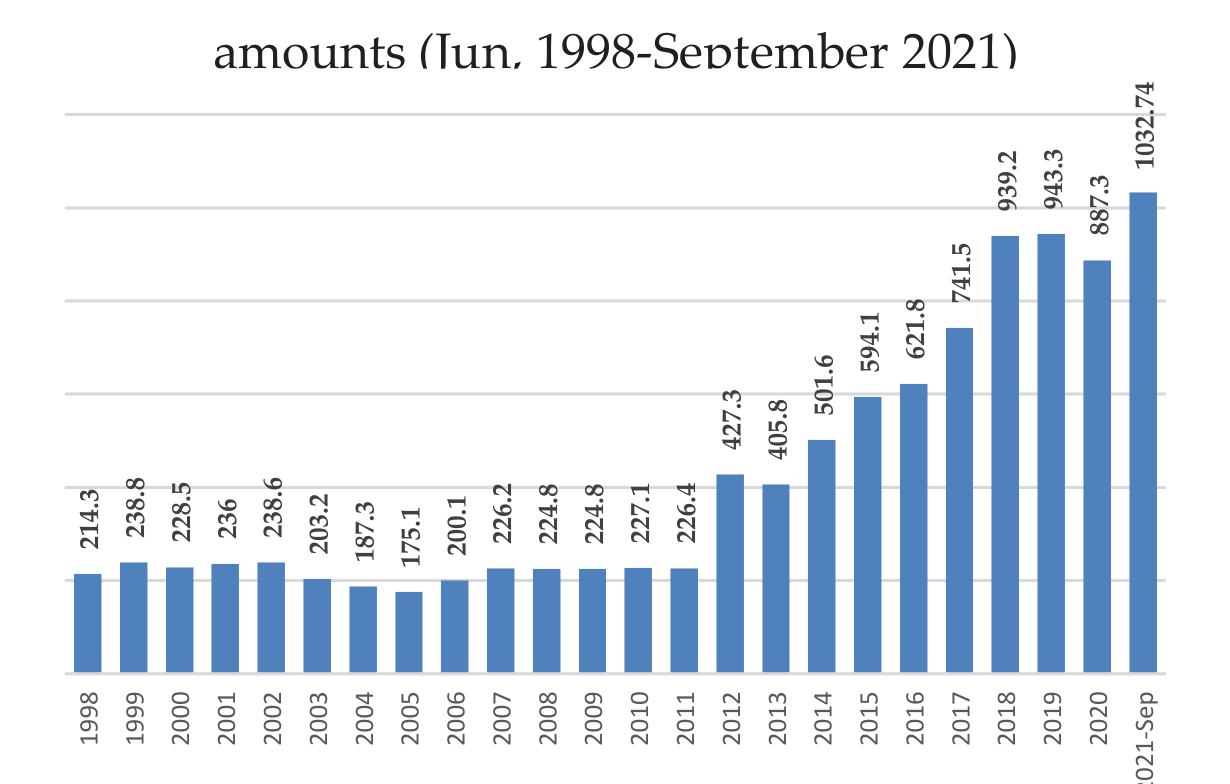
Non-performing loans are a hugely challenging issue for the banks in Bangladesh, which bears down massively on its economy. By the year 2019, non-performing loans (NPLs) amounting to almost Tk. 943 billion piled up on the balance sheets of the banks in Bangladesh. At the same time, we observe that the in flow of new NPLs were on a rising curve. After December 2019, the severity of non-performing loans was amplified by the outbreak of the COVID-19 pandemic. The total NPLs of banks has gone up from Tk. 943 billion to Tk. 1033 billion in the time period 2019 to September 2021. The spiraling tide of the coronavirus in Bangladesh affected businesses in a big way, which ultimately affected their loan repayment ability. The medical calamity combined with the banking sector’s burden caused the quality of assets to be worsened day by day.
Under the title "Non-performing Loans in Bangladesh: A Comparative study of Selected State-owned and Private Commercial Banks" this book aims to provide a thorough and proliferated picture of the changing trend of non-performing loans in Bangladesh. It focuses on understanding and implementation of the objectives of this study. The detrimental effect of non-performing loans in Bangladesh's economy and sustained low asset quality over a long period in the banking industry has motivated the author to analyze the issue thoroughly. The continuous poor performance of state-owned banks has induced a comparative analysis to better understand the prevailing condition of non-performing loans in Bangladesh. The book includes research data and innovative, comparative studies on NPLs.
The work's inspiration is based on the author's practical and day-to-day experience in the banking arena backed up by relevant academic background. The book was written with the view that it will help readers understand NPL's current scenario and its severe impact on the country’s economy. The author also hopes that this book will be a foundation to inspire and spawn further research, new ideas and genuine knowledge in the field of banking. In conclusion, the book leaves the readers to assess its usefulness to disseminate ideas, questions and solutions offered by the author.
Finally, the author thanks those who provided the time, support, and inspiration for completing the work. The author is personally available to discuss the subject matter of this book with the readers.
Dr. Md. Ariful Islam
— Dr. Md. Ariful Islam
Table of Acronyms
📊 Data Table↔ Scroll horizontally to view full table
Table of Acronyms
ACFID
Agricultural Credit and Financial Inclusion Department
AMC
Asset Management Company
BB
Bangladesh Bank
BIBM
Bangladesh Institute of Bank Management
BIS
Bank for International Settlements
BOD
Board of Director
BRPD
Banking Regulation & Policy Department
BSEC
Bangladesh Securities and Exchange Commission
CAR
Capital Adequacy Ratio
CEE
Central and Eastern Europe
CIB
Credit Investigation Bureau
COF
Cost of Fund
CRAR
Capital to Risk Weighted Asset Ratio
CRR
Cash Reserve Ratio
DBA
Doctor of Business Administration
DSE
Dhaka Stock Exchange
ER
Exchange Rate
FCB
Foreign Commercial Bank
FSI
Financial Soundness Indicator
GDP
Gross Domestic Product
GMM
Generalized Method of Moments
IFRS
International Financial Reporting Standard
IMF
International Monetary Fund
IR
Inflation Rate
IT
Information Technology
IV
Instrumental Variable
L/C
Letter of Credit
LCB
Licensed Commercial Bank
LGR
Loan Growth Rate
LR
Lending Rate
MB
Merchant Bank
MIS
Management Information System
MP
Market Power
MLC
Money Loan Court
NBFI
Non-banking Financial Institution
NEER
Nominal Effective Exchange Rate
NII
Net Interest Income
NPL
Non-performing Loan
NSC
National Savings Certificate
OECD
Organization for Economic Cooperation and Development
PCB
Private Commercial Bank
PCGDP
Per Capita GDP
PEP
Politically Exposed People
RCOF
Real Cost of Fund
RLR
Real Lending Rate
ROA
Return on Asset
ROE
Return on Equity
SAARC
South Asian Association for Regional Cooperation
SCB
State-owned Commercial Bank
SD
Stock Dealers
SDB
Specialized Development Bank
SME
Small and Medium-sized Enterprises
SLR
Statutory Liquidity Ratio
SMA
Special Mention Account
SPSS
Statistical Package for the Social Sciences
SS
Substandard
Chapter 1
Introduction
In the last two decades, the banking sector of Bangladesh has undergone many changes in terms of policy reforms, addition of new banks and information system. Within this time frame noticeable differences have been seen in terms of asset quality and management efficiency. The reasons for management inefficiency can be many and various, like, policy, cost management, fund diversion and inexperience. This study conducts a comparative analysis between state-owned and private commercial banks through questionnaire surveys and empirical analysis. It further investigates the determinants of non-performing loans (NPLs), through questionnaire survey and empirical analysis along with the impact of excessive credit lending and cost of funds on the asset quality of the private banking sector. Before this study delves into the further history and analysis of loan classification, some important aspects of bank loans are worth mentioning. We begin with the definition of non-performing loans which is the main subject of this research around which different objectives have been formulated.
Non-performing loans
Loan constitutes a major portion of the banks’ assets which is generally shown on the asset side of the balance sheet. This study uses the term “asset quality” to measure the quality or performance of the loans of the banking sector. In general, banks lend money to the borrowers in the form of loan which is utilized by the borrowers to provide the banks with “cost of fund” and spread. For every loan, banks must keep sufficient amount of provisions prescribed by the Bangladesh Bank (Central Bank of Bangladesh). After the general provision requirements have been met, if the banks have proper valid cause for the concern of any loans to become non-performing, they can keep extra provision which is specifically called ‘the provision for non-performing loans’. Non-performing loans are also called classified loans because they have been transferred from the unclassified (performing) category to the classified (non-performing) portion of the balance sheet. The classified category consists of substandard loans, doubtful loans and loss loans. These loan categories are called non-performing loans because banks usually do not receive any interest payments from these loans for at least 90 days. The transfer of loans from the performing category to the non-performing category usually results in maintaining extra specific provisions, which is directly taken out from the capital of the banks thus resulting in a reduction in banks’ profit. A detailed classification of loans and provisions can be found in the next section. Some of the general definitions of non-performing loan are mentioned below for the convenience of the flow of the reading.
Different researchers have identified the definition of NPL more or less in a similar manner. According to Klein (2013) non-performing loans are those loans whose interest payments or principal repayments have not been made for a period of over 90 days. Minton et al. (2009) in their study mentioned that NPLs are those loans which are due for over 90 days. When obligations (interest payments) related to loans and advances becomes due for more than 90 days, banks usually consider that the borrower is unlikely to make any further payments and that is when the non-performing loan is created (D’Hulster et al., 2014). According to the World Bank, a loan is classified as non-performing when obligations related to the loan become due for over 90 days. Many researchers have used this definition in defining non-performing loans.
Gross non-performing loans: Gross NPLs are loans which are past due for more than three months. They are classified as substandard, doubtful and loss. Gross non-performing loans include the provision amount held against them.
Net non-performing loans: It is the outstanding amount of gross NPLs, net of provisioning for the purpose of non-performing loans.
Although the above-mentioned definition of non-performing loan is being used extensively around many parts of the world, some cautionis needed when making comparisons among different countries (Škarica, 2014). According to the Financial Soundness Indicator (FSI) the compilation guide of March 2006, (International Monetary Fund, 2006) loans (and other assets) should be classified as NPL when—
According to the Bank for International Settlements (BIS), the 90-day rule is used to identify a loan’s performance and a loan is called default when a loan does not produce interest payments for at least the above-mentioned time period. Additionally, according to the International Monetary Fund (IMF), non-performing loans isusually categorizedas—
Substandard (interest and/or principal are overdue for 30 to 91 days);
doubtful (interest and/or principal are overdue for more than 91 to 180 days); and]
loss loans (loan is virtually uncollectible and loans are overdue for more than a year).
Non-performing loans
In general, the quality of loans of the banking sector of Bangladesh has improved over the last two decades (figure 1.2). Despite the decline of bad loans in general, the asset quality of private commercial banks has raised concerns in the recent years. Particularly, after the stock market crash of 2011, the quality of many loans of private commercial banks has become non-performing (figure 1.2). The reasons for the increase of non-performing loans of these banks since 2012 are quite significant. First of all, the inadequate and improper procedures in giving out loans to improper clients are held responsible for this. It is quite acceptable for some non-performing loans to persist in every economy but any form of long-term inclination of non-performing loans can be extremely detrimental. The arbitrary trend of rising NPLs in Bangladesh has created concern for the economic stability and protection of depositors’ money. Each step in the loan disbursement procedure is as important as the other. However, the correct decision about the evaluation of the loans at the very beginning, bears much of the weight whether a loan is going to properly be utilized or not. In Bangladesh, most of the loans are distributed by reference and without proper investigation. Many bank personnel are heavily dependent on references for giving out the loans. This concern could be avoided by the banks’ proper evaluation and investigation before sanctioning the loans.
Political influence has heavily plagued the financial sector in Bangladesh with its sheer dominance in determining loan sanction. When political intervention plays a major role in credit selection, it eventually leads to a failed banking system. At times, it is not so much power and references, as the neglect of regular evaluations that is responsible for increase in number of bad loans.
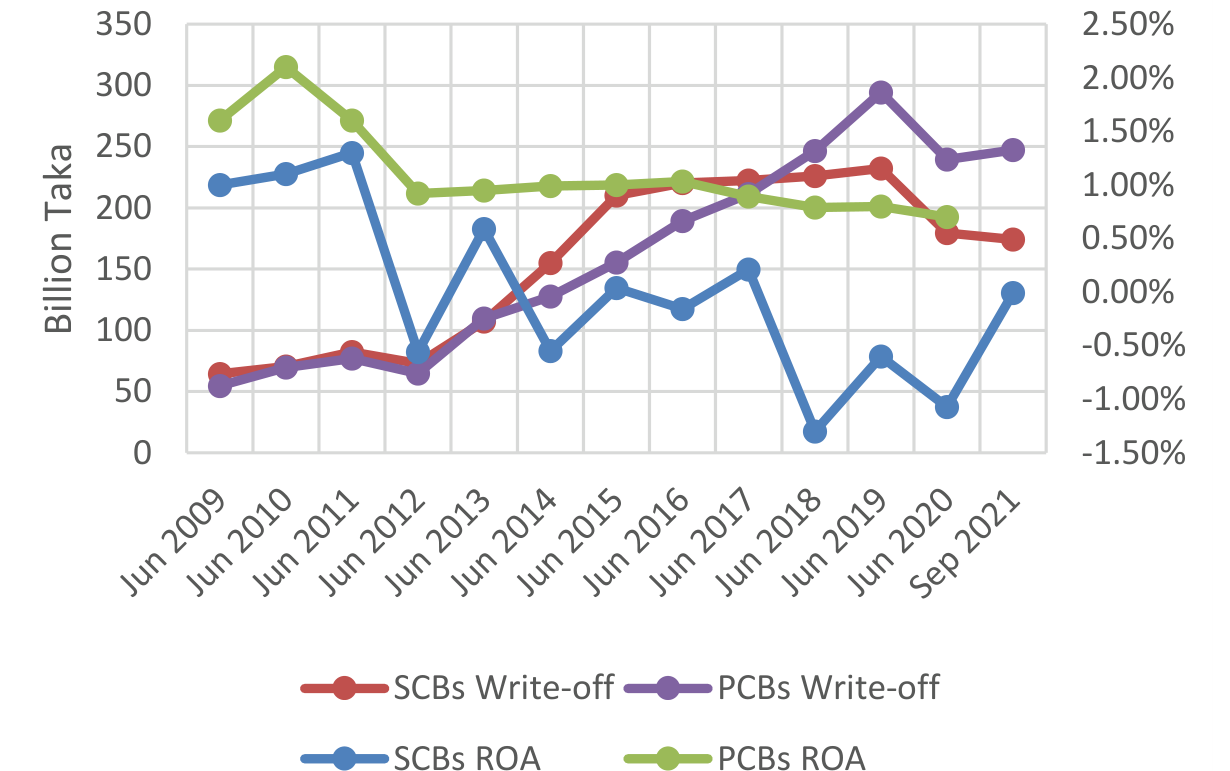
Coming back to the current condition of non-performing loans of Bangladesh, it is important to follow certain trends in loan quality before any assumption can be made. The total non-performing loan of Bangladesh has gone up from Tk. 224.8 billion to Tk. 1033 billion in the time period 2009 to September 2021. Another reality attached to the history of NPL in Bangladesh is the rising trend of writing-off bad debts. The state-owned commercial banks and the private commercial banks have been in a marathon for writing off bad debts. The total loans which were written- off up to Sep 2021 were 151 percent higher than the loans which were written-off in 2010. The total written-off bad debts up to September 2021 were Tk. 436.1 billion. Of this total amount, the primary contributors are the state-owned commercial banks who wrote-off approximately 40 percent of the total written-off loans up to September 2021. In figures 1.2 and figure 1.3, the rapidly declining bad loans can also be explained by the yearly write-off of the banking sector, in many instances. Compared with other countries in South Asia and Europe, Bangladesh remains in a critical position in handling the rising number of NPL over the last few years. As this study centers on the conventional private commercial banks, the classification of the banking industry in figure 1.1 will reveal the area on which this study is based.
🔍 Tap to enlarge
Figure 1.1: Classification of the banking industry of Bangladesh
Source: Bangladesh Bank.
There are 66 banks in Bangladesh, both scheduled and non-scheduled in nature. Before the recently permitted Community Bank, Citizen Bank and Bengal Bank, there were 63 banks in Bangladesh up to September 2018. After the inclusion of these three banks, the number of private commercial banks is set at 43. The newly included Community Bank has become the forty-first local private commercial bank in Bangladesh and the number of conventional private commercial banks is set at 33 while the number of publicly listed banks at also 33. The Community Bank received permission from Bangladesh back in October 2018. The other three banks received confirmation from Bangladesh Bank in February 2019. Due to failing to meet up the capital requirements, Bangladesh Bank rejects proposed People’s Bank’s LOI (Letter of Intent) extension application and not considering the final license.
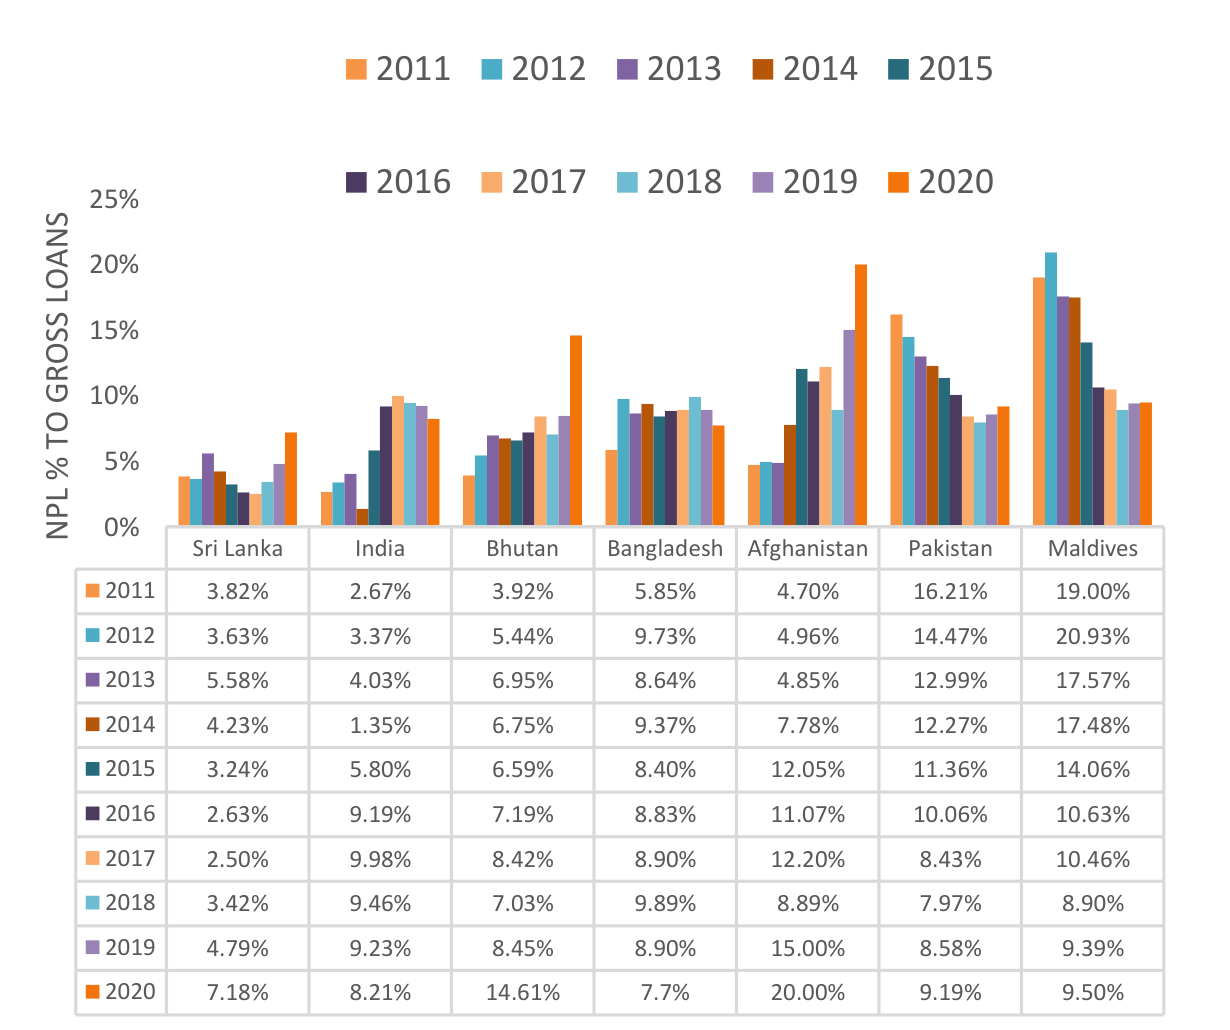
Returning to the credit quality of the banking sector of Bangladesh, the scenario of non-performing loans has improved compared with some developing countries of the region. South Asian countries like Pakistan, Maldives, Bhutan, Afghanistan and Sri Lanka has shown inclining NPLs during the years 2017 to 2020. India and Bangladesh on the other hand, have registered declining non-performing loan within the same time frame. In the current scenario of the rising NPLs in Bangladesh, it has become absolutely imperative for the country to get a grip on this.
A glimpse into the history of the non-performing loans in Bangladesh will help in analyzing the determinants of bad loan quality.
Non-performing loans
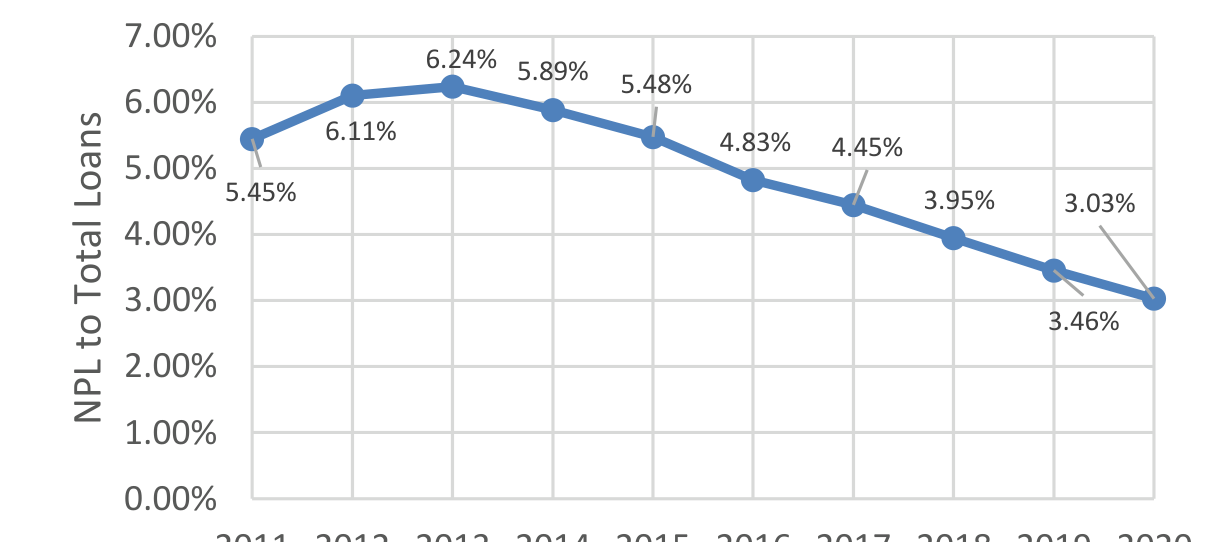
At a first glance, it may look as if the trend of the NPL ratio of the private commercial banks of Bangladesh is declining (figure 1.2). This is true if we take the trend of NPL to be constant overtime. The reality is that the responsiveness of the NPL ratio is not constant overtime. Figure 1.2 reveals that the rate at which the NPL was declining was altered and this shock was permanent because the trend at which the bad loans to total loans were declining clearly did not go back to its original track.
Figure 1.2: Non-performing loan as the percentage of total loans of the banking sector of Bangladesh
from 1998 to 2021 September.
🔍 Tap to enlarge
Figure 1.2
Source: Bangladesh Bank annual and quarterly reports.
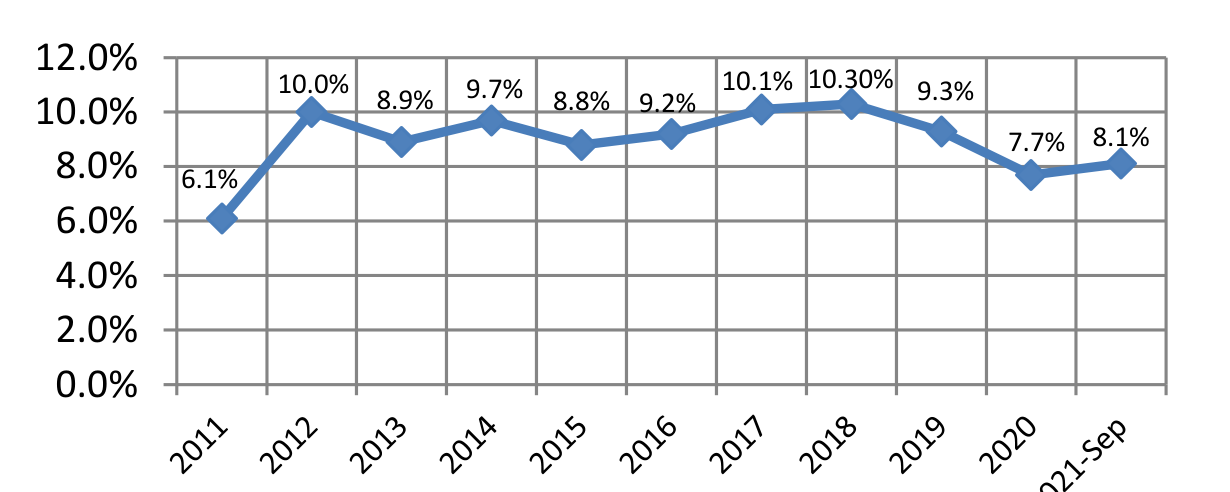
Interestingly, there are noticeable striking points which were absorbed by the initial trend. From the graph (figure 1.3), it is evident that there are three types of trend in NPL ratio from 1998 to September 2021. There was a slightly decline in the NPL ratio of the private commercial banks in Bangladesh from 1998 to September 2021. From 2012 to September 2021, the trend of NPL ratio slightly fluctuated and remained much slower compared to the preceding decade. The rising trend can be explained by the corruption of the banking sector particularly in the time period 2012–2017, and the economic malaise caused by the collapse of the share market and nationwide strikes before the national election.
Figure 1.3: Non-performing loan as the percentage of total loans of the private commercial banks of Bangladesh
from 1998 to 2021 September.
🔍 Tap to enlarge
Figure 1.3
Source: Bangladesh Bank annual and quarterly reports.
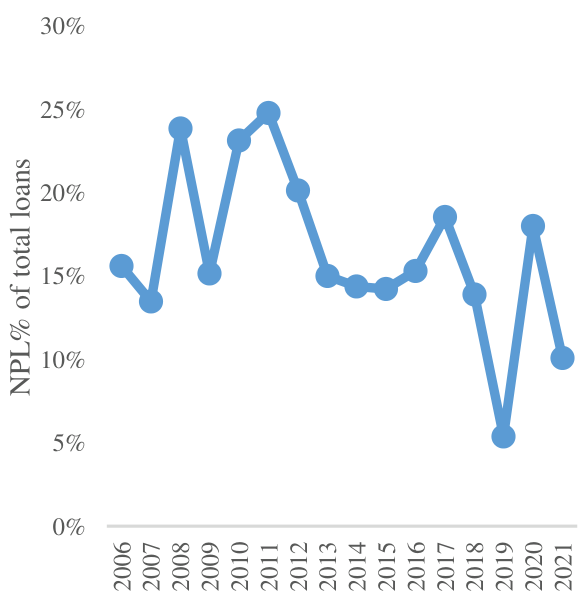
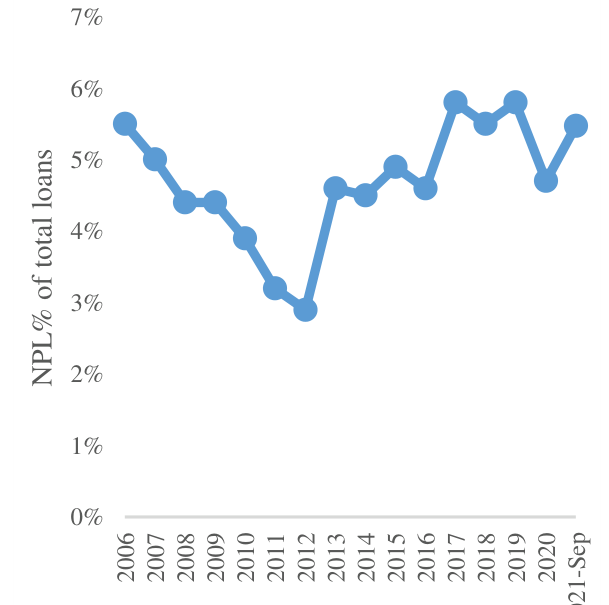
Figure 1.4: Non-performing loan as the percentage of total loans of the state-owned and private banks of Bangladesh from 2006 to 2021 September.
🔍 Tap to enlarge
Figure 1.4
Source: Bangladesh Bank annual and quarterly reports.
Figure 1.4 shows a comparative view of the non-performing loans to total loans of the state-owned and private commercial banks of Bangladesh from 2006 to September 2021. Clearly, the ratio of the bad debts or non-performing loans to total loans is much higher for the public banks in this period. Compared to the public banks, the non-performing loans of the private commercial banks of the country have maintained a relatively stable rate over the years. The concern lies with the state-owned banks because of the sharp increase in bad loans for the years from 2015 to 2021. Although there are still concerns about the relatively high NPL ratio in state-owned banks the trend of NPL ratio for state-owned banks is declining from 2019. This is a positive sign for the banking industry.
For an analysis of the causes and effects of non-performing loans, it is essential to study the pre-NPL and post-NPL situations of Bangladesh. So far, current studies have focused on the post-impact of NPLs, that is, whether the effect of NPLs is good for the economy or not.
Another issue in Bangladesh is related to the loan loss provision which is used to cover expected or unexpected loan loss or bad debts. Bangladesh Bank issues circulars on a regular basis to banks for maintaining the specific provisions for each type of loans. The performance of state- owned commercial banks and private commercial banks in maintaining provisions for loan loss has been rather disappointing over the past years. Banks are reluctant to maintain the provisions prescribed by the Bangladesh Bank because it directly affects the profitability of the banks.
This study centers around the impact of “excessive credit lending” and cost of fund on the quality of loans by private commercial banks of Bangladesh. In this regard, it is essential to discuss the condition of the loans, their growth and the cost of fund of banks over the years.
Loan classification by Bangladesh Bank
According to the Bangladesh Bank, the non-performing loans are those loans which are in a default position or which are close to being in the default position. The loans which cease to produce income for the banks are called non-performing loans. Non-performing loan is a multilevel concept rather than a single level idea, and so NPLs are classified into different categories usually on the basis on the length of their overdue (Chowdhury et al., 2002). NPL is defined as the loans overdue by more than 90 days (Louzis et al., 2012) NPLs can have huge detrimental effect on the economy because when the borrowers are unable to pay back the money, lots of economic resources become unproductive and depreciated. According to Bangladesh Bank, the categories of loans and advances are as follows—
Continuous loans: In this loan category, account transactions may be made within certain limits and the account has an expiry date for full adjustments. The examples are cash credit, overdraft etc.
Demand loans: These types of loans are repayable on demand by the bank. Liabilities which are turned into forced loans (i.e., without any previous approval as regular loans) will be treated as demand loan. For instance, forced demand loan against imported merchandise, payment against documents, foreign bill purchased and inland bills purchased.
Fixed term loans: These types of loans are repayable within a specific time period under a specific repayment schedule.
** Lone classification is subject to change as per policy of Bangladesh Bank.
Short-term agricultural and micro-credit: These types of loans will include short-term credit as listed under the Agricultural Credit and Financial Inclusion Department (ACFID) of Bangladesh Bank. Those credits which are repayable within 12 months inthe agricultural sector will also be included herein. Short-term micro-credits will include any micro-credits not exceeding an amount determined by the ACFID of Bangladesh Bank from time to time and repayable within 12 months, be those termed under any name such as non-agricultural credit, self-reliant credit, weaver’s credit or bank’s individual project credit.
According to the Bank for International Settlements (BIS), standard loan classifications are defined as follows:
Passed: Loans paid back.
Special mention: Loans to corporations, which may experience some trouble in repayment due to business cycle losses.
Substandard: Loans whose interest or principal payments are longer than three months in arrears of lending conditions are eased. The banks make 10 percent provision for the unsecured portion of the loans classified as substandard.
Doubtful: Full liquidation of outstanding debts appears doubtful and the accounts suggest that there will be a loss, the exact amount of which
** Lone classification is subject to change as per policy of Bangladesh Bank.
cannot be determined yet. Banks make 50 percent provision for doubtful loans.
Virtual loss and loss (unrecoverable): Outstanding debts are regarded as not collectable, usually loans to firms which applied for legal resolution and protection under bankruptcy laws. Banks make 100 percent provision for loss loans.
Basis for loan classification
Pastdue/overdue
Any continuous loan if not repaid/renewed within the fixed time limit for repayment will be treated as overdue from the following day of the expiry date.
Any demand loan if not repaid within the fixed time limit for repayment or after the demand by the bank will be treated as “overdue” from the following day of the expiry date or demand date.
In case any installment(s) or part of installment(s) of a fixed term loan is not repaid within the fixed expiry date or duedate, the amount of unpaid installment(s) as well as the loan will be treated as “overdue” from the following day of the expiry date or due date.
If a short-term agricultural loan or micro-credit is not repaid within the fixed time limit for repayment will be considered “overdue” after six months of the expiry date.
** Lone classification is subject to change as per policy of Bangladesh Bank.
If any loan or part of it or accrued interest thereon to any person/organization of his/its own or related concern remains “overdue” for more than six months, the borrower availing of such loan facility will be treated as defaulted borrower as per Section 5 of the Banking Companies Act, 1991.
All unclassified loans other than special mention account (SMA) loans will be treated as standard.
A continuous loan, demand loan or a term loan which remains overdue for a period of two months or more will be put into SMA category. Here the benefit of the special mention account is that it points out the first sign of weakness and warning signals show up to highlight potential problems in a focused manner. Loans in the special mention account will have to be reported to the Credit Investigation Bureau (CIB).
Loans, except short-term agricultural and micro-credit in the special mention account and substandard, will not be treated as defaulted loan for the purpose of the Section 27 KA (3) of the Banking Company Act, 1991.
** Lone classification is subject to change as per policy of Bangladesh Bank.
Any continuous loans will be classified as—
Substandard: Past due/overdue for three months or more than three months but not less than six months.
Doubtful: If the loan is due for more than six months but less than nine months.
Bad/loss: If the loan is overdue for more than nine months.
Any demand loan will be classified as—
Substandard: If the loan remains past due/overdue for three months or beyond but not over six months from the date of expiry of claim by the bank from the date of creation of forced loan.
Doubtful: If the loan remains past due/overdue for six months or beyond but not over nine months from the date of expiry of claim by the bank from the date of creation of forced loan.
Bad/loss: If the loan remains past due/overdue for nine months or beyond from the date of expiry or claim by the bank or from the date of creation of forced loan.
Qualitative judgement for basis of classification
by Bangladesh bank
Apart from the objective criterion, which is the identification of default loans as per their timeframe, a
** Lone classification is subject to change as per policy of Bangladesh Bank.
qualitative judgment is done when any uncertainty arises in recovery of any continuous loan, demand loan or fixed term loan. If any doubt arises about the impairments of capital, decreasing collateral and so on, the loans are classified on the basis of qualitative judgment.
Special mention
Bangladesh Bank has identified some deficiencies of the bank management and the obligor which if arises; the assets must not be classified higher than they are. The deficiencies of the bank management are—
The loans were not made in compliance with the bank’s internal policies
Failure to maintain adequate and enforceable documentations.
Poor control over collateral
Assets must be classified no higher than special mention if any of the following deficiencies of the obligor is present—
Occasional withdrawal within the past year
Below average or declining profitability
Barely acceptable liquidity
Problems in strategic planning
** Lone classification is subject to change as per policy of Bangladesh Bank.
Substandard
If the following deficiencies of the obligor is present, the assets must be classified no higher than the special mention—
Recurrent overdrawn
Low account turnover
Competitive difficulties
Location in a volatile industry with an acute drop in demand.
Very low profitability which is also declining
Inadequate liquidity
Cash flow less than repayment of principal and interest
Weak management
Doubts about the integrity of the management
Conflict in corporate governance
Unjustifiable lack of external audit
Pending litigation of a significant nature
If the primary sources of repayment are insufficient to service the debt and the bank must look to secondary sources of repayment, including collateral, the assets must be classified no higher than substandard.
If the banks have collected the asset without the types of adequate documentation of the
** Lone classification is subject to change as per policy of Bangladesh Bank.
obligor’s net worth, profitability, liquidity and cash flow that are required in the banking organization’s lending policy, or there are doubts about the validity of that documentation, assets must be classified no higher than substandard.
Doubtful
If the following deficiencies of the obligor are present, the assets must be classified no higher than doubtful—
Permanent overdrawn
Location in an industry with poor aggregate earnings or loss of markets.
Serious competitive problems
Failure of key products
Operational losses
Illiquidity
Including the necessity to sell assets to meet the operating expenses.
Cash flow less than required interest payments
Very poor management or hostile management
Doubts about the true ownership
Complete absence of faith in financial statements
If the following deficiencies of the obligor are present, the assets must be classified on higher than bad/loss—
** Lone classification is subject to change as per policy of Bangladesh Bank.
The obligor seeks new loans to finance operational losses
Location in an industry that is disappearing
Location in the bottom quartile of its industry in terms of profitability
Technological obsolescence
Very high losses
Asset sales at a loss to meet operational expenses
Cash flow less than production costs
No repayment source except liquidation
Presence of money laundering, fraud, embezzlement or other criminal activity
No further support by owners
In general, general provisions are balance sheet items representing funds set aside by a company as assets to pay for anticipated future losses. For banks, general provisions is considered to be supplementary capital under the Basel Accord.
Maintenance of provisions by the banks
In the simplest term, provisioning is the amount of money banks put aside or does not use to give out as loans to the borrowers. This is done to secure the money of the
** Lone provisioning is subject to change as per policy of Bangladesh Bank.
depositors who could for any reason claim the money they have deposited. Although it is unlikely all the depositors will claim their money before the money matures, there is still some amount of risk banks bear for not keeping 100 percent provisioning against all deposit. We know banking sectors’ provisioning rises as default loan increases.
Loan classification and provision by Bangladesh Bank
Table 1.1: Loan classification and provision by the Bangladesh Bank
📊 Data Table↔ Scroll horizontally to view full table
Table 1.1: Loan classification and provision by the Bangladesh Bank
III) Loans to Brokerage Houses/Merchant Banks/ Stock Dealers
IV) Other than SMEF, CF, BHs/ MBs,/SDs
3
Fixed term loan
I) Small and Medium Enterprise Financing (SMEF)
II) Consumer financing (Other than HF & LP)
III) Housing finance (HF)
** Lone provisioning is subject to change as per policy of Bangladesh Bank.
** Lone provisioning is subject to change as per policy of Bangladesh Bank.
IV) Loans for professionals to set up business (LP)
V) Loans to Brokerage Houses/Merchant Banks/ Stock Dealers
VI) Others than SMEF, CF, HF, LP, BHs/ MBs, /SDs
4
Short-term agricultural credit and microcredit
I) Short-term agricultural credit
II) Micro-credit
5
Staff Loan
Source: Bangladesh Bank circular letters
General Provisions:
Table 1.2: General provisions
📊 Data Table↔ Scroll horizontally to view full table
Table 1.2: General provisions
1%
Against all unclassified loans (other than loans under consumer financing, loans to brokerage house, merchant banks, stock dealers, etc. and special motion account).
5%
Against unclassified amount for consumer financing other than house financing and loan to professional financing.
Against unclassified amount for consumer financing other than house financing and loan to professional financing.
2%
Against the unclassified amount for housing and loans to professional financing.
Against the unclassified amount for housing and loans to professional financing.
2%
Against un classified amount for loans and brokerage house, merchant banks, stock dealers.
Against un classified amount for loans and brokerage house, merchant banks, stock dealers.
** Lone provisioning is subject to change as per policy of Bangladesh Bank.
** Lone provisioning is subject to change as per policy of Bangladesh Bank.
** Lone provisioning is subject to change as per policy of Bangladesh Bank.
5%
Against the outstanding amount of loans kept in the ‘Special Mention Account’ after deducting the amount of interest suspense account.
Against the outstanding amount of loans kept in the ‘Special Mention Account’ after deducting the amount of interest suspense account.
1%
Against the off balance sheet exposures. (Here Bangladesh Bank has stated that total exposure and the amount of cash margin or value of eligible collateral will not be deducted while computing off-balance sheet exposure).
Against the off balance sheet exposures. (Here Bangladesh Bank has stated that total exposure and the amount of cash margin or value of eligible collateral will not be deducted while computing off-balance sheet exposure).
Source: Bangladesh Bank circular letters
Specific provisions:
Table 1.3: Specific provisions
📊 Data Table↔ Scroll horizontally to view full table
Table 1.3: Specific provisions
Substandard
Doubtful
Bad/loss
Classified
Continuous loans
20%
50%
100%
Classified
Demand loans
20%
50%
100%
Classified
Fixed term loans
20%
50%
100%
Provision for short-term agricultural and micro-credits:
Table 1.4: Provision for short-term agricultural
and micro-credits
📊 Data Table↔ Scroll horizontally to view full table
and micro-credits
1
All credits except Bad/Loss’ (i.e., ‘Doubtful’, ‘Substandard’, irregular and regular credit accounts)
5%
2
Bad/Loss
100%
Source: Bangladesh Bank circular letters
Rate of provisions by Bangladesh Bank
Table 1.5: Rate of provisions by Bangladesh Bank
📊 Data Table↔ Scroll horizontally to view full table
Table 1.5: Rate of provisions by Bangladesh Bank
Particulars
Particulars
Short term agri. credit
Consumer financing
Consumer financing
Consumer financing
SMEF
Loans to BHs/ MBs/ SDs
All other cred- its
Particulars
Particulars
Short term agri. credit
Other than
HF, LP
HF
LP
SMEF
Loans to BHs/ MBs/ SDs
All other cred- its
Unclassified
Stand
ard
1%
5%
1%
2%
0.25%
2%
1%
Unclassified
SMA
1%
5%
1%
2%
0.25%
2%
1%
Classified
SS
5%
20%
20%
20%
20%
20%
20%
Classified
DF
5%
50%
50%
50%
50%
50%
50%
Classified
B/L
100%
100%
100%
100%
100%
100%
100%
Source: Bangladesh Bank circular letters.
CF=Consumer Financing, HF=Housing Finance, LP=Loans for Professionals to Set up Business, SMA=Special Mention Account, SS=Substandard, DF=Doubtful, B/L=Bad/Loss
Provisions to cover all expected losses: Bangladesh Bank encourages the banks to set aside higher provisions if expected losses on the loans pools (for general provisions) or individual loans (for specific provisions) require.
Base for provisions: Provisions will have to be made on the outstanding balance of the classified loans less the amount of interest suspense and the value of eligible collateral:
Deposit with the same bank under lien against the loan;
government bond/savings certificate under lien; and
guarantee given by Government or Bangladesh Bank.
Provision calculation: Provisions = Amount due – (interest suspense value + value of the eligible collateral) For every other eligible collateral, the provisions will be maintained at the stated rates under the general provisions table mentioned above—
outstanding balance of the classified loan less the amount of interest suspense and the value of eligible collateral; and
15 percent of the outstanding balance of the loan.
Eligible collaterals: Generally, the collateral is an asset which the borrowers offer to the banks to take loans. On the other hand, it is the asset which the lenders take up to secure loans if for any reason the
borrowers fail to make regular loan payments to the banks. As per Bangladesh Bank guideline, the following collaterals will be included as eligible collateral in determining base for the provision against loans to the borrowers—
100 percent of deposit under lien against the loan.
100 percent of the value of government bond/savings certificate under lien.
100 percent of the value of guarantee given by Government or Bangladesh Bank.
100 percent of the market value of gold or gold ornaments pledged with the banks.
50 percent of market value of easily marketable commodities kept under the control of the banks.
Maximum 50 percent of the market value for last
Six months or 50 percent of the face value, whichever is less, of shares traded in stock exchange.
Generally, banks in Bangladesh revalue their collaterals every two years. Bangladesh Bank has provided the criteria under which the market value of eligible collateral has to be determined—
Easily marketable goods, land and building
Loan rescheduling
When the borrowers become unable to repay the debt, they can extend their loan by making a mutual agreement with the bank for an extension of the tenure or time. In this case, the borrower can pay back their loans with longer terms. The interest rate can increase or decrease upon the discretion of the individual banks. Loan rescheduling can be done for any categories of the loan upon the discretion of the banks and the borrowers.
According to the Bangladesh Bank, loan rescheduling is often referred to as “prolongation” or “ever-greening” which is a common banking practice allowing for the renewal of a continuous and term loan. In many cases, it is possible that borrowers are in an unfortunate situation in which they are unable to repay the stipulated loan amount. Bangladesh Bank has provided the guidelines for loan rescheduling because in certain circumstances, banks overstate the capital in the balance sheet by showing the loans and advances at their full value even though those loans and advances have a low probability of repayment.
Classifications of the rescheduled loans
According to the Bangladesh Bank BRPD circular No. 08
Rescheduled loans shall be classified by the bank, with appropriate provisions.
For any category of loans neither the rescheduled loans will be considered as a “defaulted loans” nor will the borrower be considered a “defaulted borrower” unless such loans have not been repaid upon reaching the maximum number of allowable rescheduling.
Interest accrued on the rescheduled loans will be subject to the accounting treatment. The interest suspense account is shown separately in the annual report of the banks.
Guidelines for considering application
for loan rescheduling
According to the Bangladesh Bank guideline, the following instructions must be considered for loan rescheduling of non-performing loans—classified into Substandard, Doubtful and Bad/Loss.
More stringent rules for rescheduling: Banks must make a policy for loan rescheduling approved by the Board of Directors (BOD). This policy will indicate the terms and conditions under which the loans will be rescheduled and must adhere to the circular published by Bangladesh Bank. The policy adopted by the banks must not be lenient in any case. Furthermore, the banks should adapt very strict regulations for any sort of loan rescheduling. The banks must maintain such a policy, which will prohibit any form of routine scheduling and repetitive scheduling in cases where borrowers are experiencing financial difficulty or there is doubt that the full amount of the loan will not be recovered. Eventually, if banks make certain exceptions in providing rescheduling options to certain sectors or businesses that do not meet the aforementioned guideline, specific reasons must be cited justifying these special considerations.
Cautious approach for identification of bad borrowers: If borrowers ask for loan rescheduling, the banks must identify the deeper reasons for their non-performing status. In addition, if it is found that the funds were diverted for other purposes or the borrower is a habitual loan defaulter, the bank shall not consider the application for loan rescheduling and take all necessary measures for legal constrictions to recover the loans.
Actions for any down payments: If the borrowers make down payment during the application for the loan rescheduling, the banks must address the application within three months upon receipt. Any cheque, pay order or any other instrument against down payment paid should be cashed before beginning the rescheduling processes. Any previous payments made before rescheduling should not be considered as a down payment.
Consideration of the liability position of the borrowers: Before banks process any rescheduling option to the borrower, they must make sure that the borrowers will be able to repay all the debts and in case they have debts with other banks too, the liability position of the borrowers should be considered.
Evaluation of specific documents of the borrowers: Banks must vigorously go through the audited financial reports of the borrowers just in case something doesn’t slip by unnoticed, which would be necessary to spot any probability for loan default.
Factory or project visit for evaluation: Banks should make a physical visit to the business place of the clients to make sure that they would be able to pay back the loan taken after their loans have been rescheduled. Banks should preserve those visit documents and report to Bangladesh Bank.
Last dealings: If, after all verifications, it becomes evident that the borrowers will be able to make the loan payment after rescheduling, the bank may make rescheduled programs. On the contrary, if the condition of the borrowers seems unstable, the banks must make every legitimate step to recover the loans.
Proper justifications against loan rescheduling: In case, a bank actually reschedules any loan, it must identify the long-term benefits and provide statements that the rescheduling will provide for long-term profitability and capital adequacy ratio (CAR) of the bank. The bank must also make statements about the impact of rescheduling on the liquidity position and the needs of other customers.
Time limits for rescheduling for the categories loans
Bangladesh Bank BRPD Circular No. 06 dated 29 May 2013 prescribes regulations for the time limit for rescheduling continuous loans and demand loan. On the other hand, BRPD Circular No. 08 dated 14 June 2012 provides time limits for rescheduling of fixed-term loans and short-term agricultural and micro-credit loans. The later circular supersedes the information for fixed term and short-term agricultural loans and micro-credits from the previous circular.
Time limit for rescheduling continuous loan
Table 1.6: Time limit for rescheduling continuous loan
📊 Data Table↔ Scroll horizontally to view full table
Table 1.6: Time limit for rescheduling continuous loan
Frequency of
rescheduling
Classified as
substandard
Classified as
doubtful
Classified as
bad/loss
First time
Maximum 12 months from the date of being classified as substandard.
Maximum 9 months from the date of being classified as doubtful.
Maximum 6 months from the date of being classified as bad/loss.
Second time
Maximum 9 months from the expiry date of 1st rescheduling.
Maximum 6 months from the expiry date of 1st rescheduling.
Maximum 3 months from the expiry date of 1st rescheduling
Third time
Maximum 6 months from the expiry date of 2nd rescheduling.
Maximum 3 months from the expiry date of 2nd rescheduling.
Maximum 3 months from the expiry date of 2nd rescheduling
Source: Bangladesh Bank circular letters
Conditions of Bangladesh Bank:
Before any continuous loans are to be rescheduled, all required principal and interest payments must be made.
Rescheduled amount should be repaid in monthly installments.
In case the defaulted installments are equal to the amount of 3 month installments, the loan will be categorized as bad/loss.
Time limit for rescheduling demand loan
Table 1.7: Time limit for rescheduling demand loan
📊 Data Table↔ Scroll horizontally to view full table
Table 1.7: Time limit for rescheduling demand loan
Frequency of rescheduling
Classified as substandard
Classified as doubtful
Classified as
bad/loss
First time
Maximum 9 months from the date of being classified as substandard.
Maximum 6 months from the date of being classified as doubtful.
Maximum 3 months from the date of being classified as bad/loss.
Second time
Maximum 6 months form the expiry date of 1st rescheduling.
Maximum 3 months from the expiry date of 1st rescheduling.
Maximum 3 months from the expiry date of 1st rescheduling.
Third time
Maximum 3 months from the expiry date of 2nd rescheduling.
Maximum 3 months from the expiry date of 2nd rescheduling.
Maximum 3 months from the expiry date of 2nd rescheduling.
Source: Bangladesh Bank circular letters
Conditions made by Bangladesh Bank:
Before any demand loans to be rescheduled, the condition requires all required principal and interest payments must be made.
Rescheduled amount should be repaid in monthly installments.
In case the defaulted installments are equal to the amount of three month installments, the loan will be categorized as bad/loss.
Time limit for rescheduling fixed term loan:
Table 1.8: Time limit for rescheduling fixed term loan
📊 Data Table↔ Scroll horizontally to view full table
Table 1.8: Time limit for rescheduling fixed term loan
Frequency of the loan rescheduling
Classified as substandard
Classified as doubtful
Classified as bad/loss
First
Maximum 36 months
Maximum 24 months
Maximum 24 months
Second
Maximum 24 months
Maximum 18 months
Maximum 18 months
Third
Maximum 12 months
Maximum 12 months
Maximum 12 months
Source: Bangladesh Bank circular letters
Over and above the guidelines provided by Bangladesh Bank regarding loan rescheduling, it has stipulated certain conditions that are to be maintained. They are as follows—
During the rescheduled period, all necessary principal and interest payments must be made.
Rescheduled amount should be repaid in monthly/quarterly installments.
If the quantity of defaulted installments is equal to the amount of six month of two quarter installments, the loan will be classified as bad/loss.
D. Time limit for rescheduling for short-term agricultural and micro-credit:
For the rescheduling of any classified short-term agricultural and micro-credit, six months can be added after the expiry date of the last installment. This mainly determines the repayment schedule which starts from the day of rescheduling. According to the BRPD Circular No. 06 published in 29 May, 2013, if the loans are rescheduled after the expiry date, the following time-limit will be pertinent:
📊 Data Table↔ Scroll horizontally to view full table
For the rescheduling of any classified short-term agricultural and micro-credit, six months can be added after the expiry date of the last installment. This mainly determines the repayment schedule which starts from the day of rescheduling. According to the BRPD Circular No. 06 published in 29 May, 2013, if the loans are rescheduled after the expiry date, the following time-limit will be pertinent:
First rescheduling:
Repayment time limit for rescheduling should not exceed 2 years
Second rescheduling:
Maximum one year
Third rescheduling:
Maximum 6 months
Regulations regarding the down pament of term loans
When the borrower applies for loan rescheduling for the first time, the request will be granted on the condition of receiving cash payment of at least 25 percent of the overdue installments, or 10 percent of the total outstanding amount, whichever isless.
Applying for the second time for rescheduling will be granted upon receiving cash payment of minimum 30 percent of the overdue installments or 20 percent of the total outstanding amount of loan, whichever is less.
Applying for the third time for rescheduling will be granted upon receiving cash payment of minimum 50 percent of the overdue installments or 30 percent of the total outstanding amount of loan, whichever is less.
The same regulations also apply to short-term agricultural and micro-credit loans.
Regulations regarding the down payment to demand loans and continuous loans
As mentioned earlier, demand loans are loans which are required by the banks upon the need of the bank.
Whenever a demand loan or continuous loan is converted into a term loan, according to the BRPD Circular no. 08, first rescheduling may take place against down payment on the basis of loan amount—
📊 Data Table↔ Scroll horizontally to view full table
Whenever a demand loan or continuous loan is converted into a term loan, according to the BRPD Circular no. 08, first rescheduling may take place against down payment on the basis of loan amount—
Loans that are overdue
Rate of down payment
Up to Tk.1.00 (one) crore
15%
Above Tk.1.00 (one) crore and up to Tk.5.00 (five) crore
10% (but not less than Tk.15.00 lac)
Above Tk.5.00 (five) crore
5% (but not less than Tk.50.00 lac)
Upon rescheduling of any continuous or demand loans for the second time the application for rescheduling of such loans shall be considered upon receiving cash payment of minimum 30 percent of the overdue installments or 20 percent of the total outstanding amount of loan, which ever is less.
For the third rescheduling (second time after being converted partly or wholly into term loan) minimum 50 percent of the overdue installments or 30 percent of the total outstanding amount of loan, whichever is less, shall have to be repaid in cash.
Rational of the study
In order to ensure a stable and strong economy, a country must have a sound banking environment and a smooth banking process. Companies take part in business activities both domestically and internationally with financial assistance from the banks. Apart from international trade, a country also consists of domestic infrastructures which are financed and extended by taking loans from the banks. Here the rationale of this study comes into play. If the banks become unable to collect the loaned amount overtime, the risk of non-performing loans become stronger. Therefore, the NPL inclines and creates a pressure over the bank and in turn, it affects the profitability of the bank. This ultimately affects the economy in general and other performing loans and new loans as well. Therefore, an empirical study is imperative to tackle these issues. Focusing more on the root cause can help alleviate this growing problem in our country. In recent years, the impact of rising non-performing loans has become severe because of the decreasing profit of commercial banks and the declining loan growth.
It is necessary to understand the underlying causes contributing to the steep rise in non-performing loans, on account of its impact on our financial system. Besides, these NPLs will drastically slow down the economy, if proper measures are not taken with utmost diligence and authority.
Various researches have shown that there is a positive correlation between non-performing loans and bank-specific, macroeconomic variables. Beside these variables, some researchers have identified that management quality also affect non-performing loans. Dimitrios (2011) showed that non-performing loans is influenced heavily by real GDP, unemployment rate, interest rate and other macroeconomic variables. Many researchers from various countries established a positive relationship between bank-specific variables and macro-variables. Regardless of the difficulties in identifying the variables, it is important to pinpoint the particular bank-specific and macro- economic factors for the financial stability of our country.
A country’s financial stability is directly and indirectly correlated with the banking system of a country. Money borrowed from banks is transformed into investment by individuals to foster the economy, thereby creating employment and generating income for the country. In the process of this economic growth, the default or near default loans constitute an impediment in the capital accumulation of the bank. The bank could have given these moneys to some other individual as loans and reaped profit from it; but as the loans become non-collectible, the banks loses profitability which in turn creates an internal pressure on the bank. The piling of a large number of such non-performing loans lead to a blockage in the economic development of the country.
A lot of research has been undertaken to identify the correct determinants of non-performing loans in Bangladesh, including the political and governance-related reasons. Many studies have used comparative analysis between different bank groups (e.g., private, public, foreign and specialized, etc.) to understand the effect of different variables on different banks. They show that not all variables impose the same effect on the credit quality or profitability rather the effect varies with different banks. For example, it is possible that bank size may be a non-issue for some banks and a burden for another.
Uniqueness of this study
The contribution of this study aims to fill some of the gaps in the literature of NPL in the context of Bangladesh. The contribution of this study is as mentioned below—
Although it focuses on the aggregate level of NPLs of the private commercial banks, different models used in this study identify how macroeconomic variables affect NPL differently in the context of bank-specific variables—
Long-term impact of variables: Long-term effects of bank-specific variables mean that certain actions of banks (unrelated to the market or the competitors) may bring about a risk in the loan condition even after a long period of time. The long-term economic impact shows the sensitivity of banks to the overall economic phenomena. This indicates how a country’s economic environment affects banks, particularly private commercial banks. We have used the determiner per capita GDP (instead of GDP) to analyze the effect of GDP on the overall condition of the country. This will clearly reveal the picture of development of the country, with respect to population variation.
Long-term impact of GDP: This focuses on how the private commercial banks are responding in terms of credit risk management in the current development period of Bangladesh when the GDP and GDP per capita are growing rapidly. The study also alludes to the short and long impact of some macroeconomic factors.
As mentioned earlier, certain bank-specific factors can have long-term effects on the loan condition. This study aims to find out the effect of loan growth, cost of fund, real cost of fund, average lending rate and real average lending rate from a long-term point of view. There is an effort to arrive at an understanding of the power of each of these independent variables to bring about changes in the credit risk from a long run perspective. The use of different models in this study also identifies the mutual exclusivity of these variables in explaining the variation of the credit risk.
Long run impact of cost of fund: The impact of the independent effect of cost of fund on the quality of loans can create long run implications because of the liquidity crisis in the banks. If banks lend excessively there will be a shortage of funds and to make up for the possibility of sudden withdrawal by the depositors, banks may have to borrow more deposits at higher cost, which may affect the lending rate. A fact to note here is that the lending rate operates at float (which can change according to the market) and banks may raise the lending rate to cover the high cost of fund, which can trigger delayed payments. This delayed payment can cost banks to keep provisions from their profit, which can affect their earnings as well. Therefore, there is a possibility that high cost of fund can affect the quality of loans and affect the earnings of banks in the long run.
Dynamic panel data with time dummies: Finally, this paper considers two types of determinants in explaining the variation of the NPL ratio of the private commercial banks of Bangladesh. They are namely bank-specific variables and the macroeconomic (systematic) factors. The individual bank-specific heterogeneity has been accounted by first differentiating the explanatory variables through Arellano & Bond estimation. At this point one thing to be noted is that the effect of unobserved heterogeneity could be easily understood if different categories of banks were used in this study. As the sample in our study is more clustered towards a certain group, it is not easy to identify the individual effects. Therefore, certain tactics need to be used to tackle the risk of letting the unobserved heterogeneity remain in the estimation. Although it is possible to let the unobserved effects stay as a random phenomenon in the estimation, this study have used GMM estimation with first differencing to remove the effect of individual heterogeneity. Regarding the two types of variables, our aim is to identify the effect of loan growth rate, cost of fund and average lending rate after controlling for the same macroeconomic and bank-specific factors.
The methodology is to form a baseline model that has the highest explanatory power. Loan growth rate, cost of fund and average lending rate has been used in the bank-specific determinants part in different models with the same controlled variables. The different model approach should give insight into how the NPL ratio changes with different interaction. The bank-specific variables have been selected from the literature of the determinants of NPLs.
Questionnaire survey with five point LIKERT scale: Data gathered from field survey report has been analyzed with five point LIKERT scale for both the determinants of non-performing loans and the comparative analysis part.
Objectives of the study
This study attempts to perform a comparative analysis between the state-owned and private commercial banks from a questionnaire survey and empirical point-of-view. However, before finding some of the important comparative factors, this thesis highlights the impact of excessive credit lending and cost of fund on the condition of non-performing loans of the private commercial banks of Bangladesh. Furthermore, to find the perception of borrowers and bankers regarding the determinants of non-performing loans and the relevant comparative factors to identify state-owned and private commercial banks, the following objectives have been formulated:
To determine and identify the effects of excessive credit growth on the long run credit quality.
To understand the effect of cost of fund on non-performing loans.
To find out the causes of non-performing loans from the perspective of bankers and borrowers of Bangladesh.
To compare the “non-performing loans” of selected state-owned and private commercial banks of Bangladesh.
Objectives of the study
The report and findings of this thesis is central to the conventional state-owned and private commercial banks of Bangladesh. The time period of the comparative analysis between state-owned and private commercial banks has been taken from 2009 to 2017. The time period for the analysis of the determinants of non-performing loans has been taken from 2006 to 2017. The study only accommodates state-owned and private commercial banks of Bangladesh. Field survey has been performed to formulate the general perception of bankers and borrowers regarding the important determinants of non-performing loans, specifically acknowledging the effect of cost of funds on the quality of assets. Another questionnaire survey has been conducted to bring out the perception of bankers and borrowers regarding the comparative factors between the state-owned and private commercial banks of Bangladesh. The Likert scale has been used to formulate questionnaires. Regression analysis for all the secondary data has been performed with dynamic panel data model controlling for time dummies. Controlling for time dummies increases the chance to acquire more accurate effect of the bank-specific variables on non-performing loans. Despite controlling for macroeconomic variables with time dummies, other important macroeconomic factors have been included in alternative models to have a deeper understanding of the impact of certain bank-specific variables in different economic conditions.
Limitations of the study
In this study, the selected banks are all conventional private commercial banks and state-owned commercial banks, but a complete understanding of the banking industry requires understanding all the scenarios of all the banks. Therefore, there is an opportunity for future projects and studies related to all the banks of Bangladesh.
Different methods can be used to do this same research which may agree or disagree with this study. In this regard, future studies can emphasis on particular sectors like corporate, SME, retail and agriculture, etc. to identify the variables for these particular sectors. Sector-wise non- performing loans are not available from most of the annual report of these banks which are necessary to conduct any industry-specific analysis regarding asset quality. Every bank does not follow the same categorical loan classification used to compare various effects of non- performing loans on different industries. Most of the cases loan-wise lending rate and even the weighted average lending rate is not available in the annual report which reveals the exact relationship between sector-wise non- performing loans and the exact lending rate.
The existing literature of the determinants of non-performing loans has been primarily divided into two parts. One part discusses the impact of bank-specific variables whereas the other part is chiefly concerned with the macroeconomic impact. Besides these two major sections of the literature on the determinants of non-performing loans, many researchers have also conducted various analyses on single variables to understand the impact of any single variable on the quality of loans.
Furthermore, many researches have also focused on the comparative analysis of different bank groups. This study calls for a comparative analysis of state-owned and private commercial banks after establishing the effect of certain bank-specific and macroeconomic variables on the condition of non-performing loans. From the following section the discussion centers on the determinants of non-performing loans and after that, the study presents the relevant comparative analysis between the two banking groups.
For ease of understanding, the following literature review has been divided into four sections. The first section discusses the general determinants of non-performing loans which involves both bank-specific and macroeconomic variables. The second section discusses studies that explore the relationship between interest rates and non-performing loans. The third section discusses the literature pertaining to the relationship between cost of fund and non-performing loans. The final section puts forward different research papers on the comparative analysis between different bank groups from the domestic and international point of view.
A majority of banking researches in Bangladesh has focused on common banking issues such as handling of classified loans or non-performing loans. The NPLs and its impact on the economic and financial stability of the country have been highlighted too, in many studies.
The existing literature confirms that bank-specific determinants, macroeconomic variables and regulatory frameworks influence the capital of a bank. Specific factors such as real total loans and credit policy implemented by the banks figure in as well. Besides, many studies have shown that macroeconomic determinants like real GDP per capita, interest rate, inflation, unemployment rate and so on play an important factor in affecting the non-performing loans of the banks.
Different countries follow different standards for determining non-performing loans. Generally, and internationally, a NPL is defined as a sum of borrowed money upon which the debtors have not made his or her scheduled payments for at least 90 days. A non-performing loan is either default or close to being default. This study highlights the effect of loan growth rate, average lending rate and the cost of fund on the credit risk of the private commercial banks. It also presents the effects of these variables as the determinants of change in the performing condition of loans.
Regarding loan losses of banks, the study of Keeton and Morris (1987) showed that macroeconomic factors were responsible for a lower payback. Their research concluded that too much loaning in a sector is a major cause of high bad debts, because of the bad performance in that sector. This study also highlighted that risk taking behavior of banks also lead to greater loan-loss ratios. Other studies advised a balanced issue of credit for all sectors of the economy.
In the last decade, particularly after the crash of stock market, the banks in Bangladesh have witnessed a rise in non-performing loans. Rifat (2017) studied the determinants of NPL in non-banking financial institutions (NBFI) sector of Bangladesh. Even in this case, the data showed that firm-specific variables like loan growth and loan-to-asset ratio explained some of the fluctuations in the total credit risk of the non-banking financial institutions.
Another recent study by Rahman et al. (2016) identified the impact of financial ratios on non-performing loans of listed commercial banks in Bangladesh. A sample of 96 observations has been analyzed during 2010–2015 and a set of robust correlations between gross non-performing loans and various bank-specific financial ratios were identified. This study demonstrated that credit-deposit ratio, sensitive sector’s loan, priority sector’s loan, net interest margin has a positive influence on non-performing loans; while unsecured loans, profit per employee, capital adequacy ratio, return on assets, investment deposit ratio have a negative impact on gross non-performing loans. They also argued that investigating credit assessment, credit monitoring, collateralized lending and also borrower’s credit culture and lending interest rates have powerful influences on non-performing loans.
A relatively recent study on the determinants of non-performing loans by Saba et al. (2012) concluded that macroeconomic factors such as interest rate and real GDP per capita have associations with NPL rate. Their analysis showed that real GDP per capita has the strongest (68 percent) impact on NPL rate. Other variables which have significant effect are—interest rate 40.7 percent and total loans 28.1 percent. It is evident from the regression analysis that there is good multiple correlation (76.8 percent) among these variables.
Another study by Louzis et al. (2012) highlighted the determinants of the NPLs in the Greek banking sector. They also found that macroeconomic variables like the lagged real GDP growth rate, unemployment rate, real lending rates and public debt have a strong effect on the level of NPLs. Moreover, bank-specific variables such as performance and efficiency possess additional explanatory power when added to the baseline model, thus lending support to the bad management hypotheses. The above-mentioned variables are thereby linked to the quality of the performing loans.
Likewise, Messai and Jouini (2013) attempted to identify variables that can affect and influence doubtful accounts at credit institutions for a sample of European banks. The report showed that GDP growth and ROA of credit institutions have a negative impact on non-performing loans. The unemployment rate and real interest rate affect impaired loans positively. Another finding showed that the provisions of the banks increased with non-performing loans.
Similarly, Makri et al. (2014) in their study found strong correlations between NPL and various lagged macroeconomic and bank-specific determinants. Their findings largely highlighted bank-specific variables like the rate of non-performing loans of the previous year, capital ratio and ROE, which stimulated NPL rate. At the same time, from the macroeconomic perspective, public debt, GDP and unemployment seem to be the three additional factors that affect the NPL index, indicating that the state of the economy of Eurozone countries is clearly linked to loan portfolio quality.
Similarly, Škarica (2014) showed in the study that the real GDP growth was the main driver for the increase of NPL rate during the previous five-year period taken into account. Additionally, here the report assumed high inflation rates caused NPL growth. The estimates indicate that a one percent higher GDP growth rate lowers the NPL ratio growth rate by 3.97 percent. A one percent point increase in the unemployment growth rate increases the NPL ratio growth rate by 1.006 percent. These estimates confirm the results of previous empirical studies on the counter cyclical nature of NPLs: their levels rise during recessions and fall during in business cycle upturns. Both these coefficients are highly statistically significant and economically very large, showing that recent economic developments in CEE (Central and Eastern Europe) countries have a strong negative impact on their financial stability.
Many studies emphasize the fact that real GDP affects non-performing loans. Through an econometric analysis Beck et al. (2013) showed that real GDP growth was instrumental for non-performing loan ratios during the past decade before the publication of the report.
In a very recent study by Dimitrios et al. (2016), other findings were established which showed that macro variables such as unemployment and growth exert a strong influence. Furthermore, bank-specific variables related to management skills and risk preferences were found to shape future NPLs. This empirical study investigated the role of tax on personal income and the output gap as potential explanatory variables. Both were found to be significant determinants of NPLs, a finding which could be useful when designing macro-prudential and fiscal policies, as well as NPLs.
Mensah (2014) showed that the small banks in Ghana should pay attention to bank-specific factors, while large banks should pay attention to both bank-specific and macroeconomic factors, when providing loans in order to reduce the level of non-performing loans. According to Ekanayake et al. 2015, bank-specific variables like operating expense to income, ROA, loan to asset ratio, loan-loss provision, loan growth, GDP growth, inflation growth and unemployment rate and market interest rate were statistically significant. Their analysis showed that bank-specific variables with macro- economic variables explained 78 percent variation of the NPLs in Licensed Commercial Banks (LCB). ROA shows significant negative relationship with NPLs. At bank-specific level, operating expense to income ratio shows positive relationship with NPLs. These findings are similar to those of Berger and Young (1997), Fofack (2005), Al- Smadi and Ahmad (2009). Vuslat 2016 presented the impact of global crisis on the dynamics of NPLs in the Turkish banking sector by an ownership breakdown from December 2002–September 2013. The paper showed that the global economic crisis had a major economic impact. According to this research, higher capital adequacy is linked with higher NPLs across all ownership categories in the aftermath of the global crisis. Higher lending is also associated with lower NPLs in non-state banks after the global crisis. The findings also suggested that higher inefficiency is associated with lower NPLs in non-state banks after the global crisis. He also concluded that the correlation between NPLs and the size of banks varied between state-owned banks and foreign banks. For foreign banks, increasing asset size enabled better risk diversification, whereas private and state-owned banks which are bigger than foreign banks took more risk which led to higher NPLs. Ultimately, the effect of macroeconomic and policy-related variables were evenly spread across different ownership categories.
Chaiporn Vithessonthi (2015) has put forward evidence from Japan about deflation, bank credit growth and non-performing loans. In the study, he wanted to show that credit growth and non-performing loans is positively correlated under low inflation and it is time dependent. Data were collected from 1990 to 2013 from publicly listed commercial banks. He concluded that the relationship between the credit growth of banks and their non-performing loans varies over time and it is not associated with banks’ profitability.
Konstantinos et al. (2015) conducted their study on a quarterly basis from 2001–2015 on the non-performing loans of Greece. They concluded that both macroeconomic and financial factors had a certain impact on NPL. They used the VAR-VEC model, which is generally used to capture the dynamic interdependencies among the variables. They also found that public debt and unemployment had a strong impact on the level of NPLs in Greece in the mentioned time period.
Abid et al. (2013) conducted their study on 16 Tunisian banks with 10 years’ data from 2003 to 2012 using the panel data method. This paper attempted to investigate the potential effects of both macroeconomic and bank-specific variables on the quality of loans. Their paper suggested that household NPLs in the Tunisian banking system occurred not only as a result of macroeconomic variables (real GDP growth rate, inflation rate, interest rates/real lending rate) but also due to the poor management quality of the banking system. Banking performance (measured by ROE) and inefficiency measured by dividing the operating expenses by the operating income, known as bank-specific variables provided sufficient explanatory power when they were incorporated in the method of analysis.
Karim et al. (2010) in their research on Malaysian and Singaporean banks have shown that there is a significant relationship between bank efficiency and non-performing loans. The researchers have used the stochastic cost-frontier method to find this relationship. Their identified cost-efficiency score was 87.68 percent which indicates that banks were wasting 12.32 percent of their inputs. Additionally, their results also supported the bad management hypothesis proposed by Berger and De Young (1997) who found that poor management in banking institutions results in bad-quality loans and therefore escalates the level of NPLs.
Perera et al. (2013) has conducted their study particularly on the selected South Asian countries like Bangladesh, India, Pakistan and Sri Lanka who seems to experience economies of scale as bank size is positively correlated with profitability. They also found that the high level of industry concentration still permits the banks to make profit. Six macroeconomic variables (i.e., GDP growth, interest rate, inflation rate, CPI, exports and industrial productions) are significantly associated with NPLs. However, unemployment, real effective exchange rates and Foreign Direct Investment are insignificantly associated with NPLs in the Pakistani banking system. This generally indicates that as the country grows economically, the debt-paying ability of individuals and firms consequently increase (Ahmad & Bashir 2013).
Hanef et al. (2012) in their study investigated the impact of risk management on non-performing loans and profitability of the banking sector of Pakistan. This study identifies the risk management techniques prescribed by the State Bank of Pakistan (SBP). Some of the risk management techniques by BSD Circular No.07, dated 15 August 2008, suggests that gap analysis, measuring risk to net interest income (NII), measure of risk to economic value, full valuation approach, convexity and value at risk techniques should be used by banks to cope with the higher non-performing loans. Shu (2002) found a negative relationship between inflation rates and non-performing loans.
The existing literature on non-performing loans in Bangladesh does not portray the long-term effect of credit growth, lending rate and cost of fund to the best of our knowledge. This study intends to fill the gap by considering the independent variables of previous years, like costof fund, lending rate and loan growth, to investigate the relationship with future credit loss.
Literature on loan or credit growth
One objective of this paper is to determine the long-term effect of the lending behavior of private commercial banks (PCBs) in Bangladesh. In this regard, the following will help to formulate the background for undertaking this research.
An early paper by Keeton (1999) used the VAR model to show a positive association between non-performing loans and lagged loan growth. The paper concluded that an excessive credit in the present could increase the amount of problem loans when the economy slows down. The paper also pointed out that credit growth can increase the number of bad loans in the future only if there is a shift in the supply of bank credit.
Klein. N. (2013) used the system GMM technique on 10 banks in 16 countries for the time period of 1998 to 2011 and found a positive (lagged 2) significant relationship between loan growth and non-performing loans. This result was true for both pre-crisis and post-crisis periods. The analysis also found lagged Euro area real GDP to be negatively associated with non-performing loans.
Ekanayake and Azeez (2015) analyzed nine commercial banks in Sri Lanka from 1999 to 2012 and found a negative relationship between the previous year’s loan growth rate and the current non-performing loans. This should not be surprising because different categories and different maturity loans can turn non-performing at a different time period—not necessarily in the same year or one or two years past. The negative relationship may suggest that the loan growth of previous year contributed to the NPL ratio by increasing long-term loans which were still performing. Some banks may prefer long-term loans rather than short-term credits which explains the negative relationship. The result is similar to the research of Khemraj and Pasha (2009) who also found a negative relationship between the lagged 1, 2 loan growth and non-performing loans. They suggested that the negative relationship can indicate the conservative approach of the banks after a bad lending experience that resulted in non-performing loans earlier. They also mentioned that banks may have reduced their loans in general which resulted in lower non-performing loans to total loans.
Apart from the negative relationship between loan growth and non-performing loans, the existing literature also shows positive associations between loan growth and bad loans. Espinoza and Prasad (2010) found a positive link between non-performing loans and two-period lagged loan growth when they analyzed 80 banks in the GCC region for the time period 1995–2008 using the dynamic panel estimation. Similarly, Foos et al. (2010) observed 10,000 individual banks of 14 major western countries from 1997–2005 and found that a loan growth currently leads to a surge in the loan-loss provision three years later and a decrease in relative interest income which also results in a lower capital ratio.
Jesus and Gabriel (2006) analyzed data from 1984 to 2002 and found a negative relationship between lagged 4 loan growth and current non-performing loans. Their analysis also revealed that lagged GDP growth had negative significant relationship with non-performing loans. They also considered how real interest rate might affect cost of fund and general lending rate. They found that lagged real interest rate had a significant positive impact on non-performing loans.
Literature on interest rate
Beck et al. (2013) investigated 75 advanced economies for the period 2000 to 2010 and found that GDP growth, nominal effective exchange rate (NEER), lending rate and share price were significantly related to non-performing loans. The empirical study found a significant positive relationship between one period’s lagged lending rate and non-performing loans. They also found lagged real GDP to be positively associated with non-performing loans.
Louzis et al. (2012) found a positive relation between non-performing loans and lagged real lending rate at 10 percent significant level for consumer loans. They also used the macroeconomic real lending rate and found when economic lending rate (inflation-adjusted) inclines, non-performing loans also inclines significantly. The paper also showed that one and two period lagged GDP growth is negatively associated with non-performing loans.
Akinlo and Emmanuel (2014) used error correction model to analyze the annual data for the time period 1981–2011 and found significant short-term positive relationship between lending rate and non-performing loans. Furthermore, their analysis found economic growth to be negatively related with non-performing loans in the long run.
Daumont et al. 2004, showed the accumulation of non-performing assets to be attributable to economic downturns and macroeconomic volatility, terms of trade deterioration, high-interest rates, excessive reliance on overly high-priced interbank borrowings, insider lending and risk.
Interest rates also affect the volume of bad loans causing floating interest rate. The investigation indicates that the effect of interest rates should be significant because the increase in interest rates lead to growth in debt and consequently the rise of non-performing loans (Bofondi and Ropele, 2011). Athanasoglou et al. (2006) studied the banking profitability determinants on Greek banking. The results indicate that equity level, productivity, inflation and cyclical output have significant positive impacts while loan loss provision and operating expenses have significantly negative relationship with bank profitability.
Similarly, Caprioand Klingebiel (2002) opined that the amount of non-performing assets (NPAs) was frequently associated with bank collapses and financial crises in both developing and developed countries. However, despite the linking of non-performing assets with the banking crisis, for investment and economic growth and for predicting future banking and financial disasters—very few studies have been done on the impact of the interest rate spread on the level of non-performing assets in Sub-Saharan Africa.
According to Kithinji and Waweru (2007), banking problems dated back as early as 1986 culminating in bank failures (37 failed banks in 1998) following the crises of 1986 to 1989, 1993/1994 and 1998: they accused these crises to NPAs which was caused by interest rate spread. For instance, when there is high intermediation cost, indicated in high-interest rate spread, borrowers may be unable to repay the loan due to the cost of such borrowings. That leads to a high risk of loan default for non-performance (Chand, 2002). As such, they are perceived as high-risk borrowers. Due to the high transaction costs associated, such borrowers are charged higher rates of interest.
Besides, Brock et al. (2000) showed that high operating costs increase spreads as they produce high levels of non-performing loans, though the volume of NPLs may differ across countries.
In Europe, Fernandez de Liset et al. (2000) econometrically identified loan losses through various banking and macroeconomic causes, using a panel data of Spanish commercial and savings banks for the period 1985–1997. The study shows that low gross domestic product (GDP) growth rate had an adverse effect on classified loans, validating that in times of recession, problem loans increase.
Additionally, Bhattacharya (2001) has pointed that increasing interest rate push the quality borrowers over to other opportunities such as capital markets, internal accruals for their necessity of funds.
Adela and Eulia (2010) used the correlation analysis on the Romanian banking system from 2006 to 2010 and found a negative relationship between non-performing loans and average interest rates on deposits and loans. Sheefeni. J. P (2016) used co-changed and error correction model to find a positive and statistically significant relationship between interest spread and non-performing loans in Namibia during 2001 to 2014. As hinted earlier about the possibility of the macroeconomic event to induce a change in the interest rates of the banks, several studies have been conducted in this regard. Amidu. M (2006) used panel data analysis during 1998 to 2004 on the banking sector of Ghana and found that the lending behavior of banks is heavily affected by the monetary policy. As changes in money supply and the rate fixed by the Bangladesh Bank is a proxy of monetary policy, it is imperative to find out the implications of the rising monetary policy rate on the non-performing loans of the bank.
Jiménez et al. (2014) in a recent paper identified the effect of monetary policy on credit risk taking and found that lower overnight interest rates induces banks to engage in higher risk-taking in their lending. A similar finding by Apel and Claussen (2012) also suggests that there is a risk-taking channel through which lower monetary policy makes the firms take more risks. They also mention that classified loans or non-performing loans and the risk-weighted assets of the banks can be the measure of the risk assessment. Regarding the monetary policy, Borio and Zhu (2012) focuses on the relationship between the changes in financial system and the risk-taking channel.
We explore these concepts of the channel of interest rates to find out whether there are any short or long-term relationships between the risk-taking channel, which is in this case the NPL, and the cost of fund. The above discussion confirms a strong linkage between a bank’s cost of fund and non-performing loans through the change in economic system of the country.
Literature on cost of found
Munialo (2014) used the data from 43 commercial banks of Kenya for the time period 2009 to 2013 on a yearly basis and found positive associations between cost of fund and non-performing loans. The paper concluded that when cost of fund went up, the banks raised the lending rate to maintain their earnings; and as a result was confronted with higher non-performing loans.
Although cost of fund may play a part in the surge of the lending rate, the lending rate itself depends on other things like the demand of loans, competition, the nation’s development policy and the fixed or floating interest rate (Suryanto, 2015). The determinant factors of lending rate constitute the analysis of cost of fund, overhead costs, net interest margin and banking tax (Dendawijaya, 2003; Suryanto, 2015). This finding is similar to a recent study of 2017 by the “micro-credit interest rates in Mexico” which mentioned the positive association between cost of funds and interest rates but emphasized various other factors like the investor’s decision and market conditions, which could increase the lending rate. The study also mentioned that the cost of funds of banks is determined by the financial markets. Besides, the cost of funds can also escalate due to higher non-performing loans for which banks have to keep extra provisions that will cause the service and monitoring cost to go up (Brochard, 2017).
Bhattarai (2015) analyzed 26 commercial banks of Nepal for the time period 2002 to 2012 and found significant positive relationship between real interest rate and non-performing loans. The paper suggested that higher real interest rates lead to an increase in the cost of fund which reduces the repayment capacity of the loans.
Literature on comparative analysis between different bank groups
Many researchers have used different bank groups such as private, local, foreign and state-owned commercial banks to conduct comparative analysis. Sensarma (2006) for instance conducted a comparative analysis between state-owned, private and foreign banks from 1986 to 2000 of the Indian banking industry in terms of efficiency and productivity. The analysis was based on the stochastic frontier approach (SFA). Karim et al. (2010) also used the SFA to investigate the relationship between non-performing loans and bank efficiency in Malaysia and Singapore. They used to the bit simultaneous regression equation to show that higher non-performing loans reduces cost efficiency. Likewise, lower cost efficiency increases non-performing loans. Their analysis used non-performing loans, total asset and the age of the banks as independent variables and efficiency as the dependent variable.
In a similar manner, Pavloska-Gjorgjieska and Stanojevic (2015) conducted a comparative study among countries, namely, Macedonia, Serbia and Croatia to find out the individual bank’s resilience to non-performing loans during the financial crisis in Greece.
Phuong (2014) conducted a thesis on the sample of six state-owned and joint stock commercial banks in Vietnam for the period 2005 to 2012. The study used fixed-effect regression method to examine the determinants of non-performing loans. Chaudhary and Sharma (2011) compared the state-owned and private commercial banks in terms of priority sector NPAs of agriculture and small-scale industries.
Current gap in the literature
Firstly, this study aims to understand the effect of lagged (long run) cost of fund and loan growth on the credit quality of the private commercial banks in Bangladesh through GMM panel data estimation. To the best of our knowledge, there is no literature regarding the effect of lagged loan growth or cost of fund on the quality of loans in the context of Bangladesh. No such research has been undertaken specifically to address such lagged effect of variables to explain the rising NPL. This study aims to fill the gap of such study of lagged loan growth and cost of fund to conduct an empirical analysis to find the relationship between non-performing loans, the previous year’s loan growth and cost of fund. Cost of fund and non-performing loan has been proposed in this study as determinants of future asset quality. Furthermore, the effect of bank size on the economies of scale of the banks has also been portrayed. To understand the effect of the market share of different banks on their condition of non-performing loans, the ratio of individual bank loans to the total loans of the banking industry has also been used.
In terms of macroeconomic variables, the lagged value of per-capita GDP and real interest rate has also been applied to understand the long-term impact of such variables in the context of Bangladesh. The long run impact of GDP on the economic indicators has extreme significance (not for its short-term or immediate effectiveness) for the delayed effect of the GDP on the economic progress of the banking sector.
Secondly, this research investigates the perception of bankers and borrowers through field survey to understand the effect of relevant factors, which directly affect the quality of loans in Bangladesh. In this regard, the relationship between non-performing loans and cost of fund has also been analyzed through a direct questionnaire. Previously, no such field survey has been conducted to understand the perception of bankers and borrowers pertaining to the relationship between cost of fund and non-performing loans.
Finally, the research aims to conduct a comparative analysis between state-owned and private commercial banks, in order to formulate different comparative factors under which public and private banks can be differentiated. To our best understanding through our review of the current literature available in Bangladesh, no such comparative analysis has yet been attempted. Furthermore, the comparative analysis uses the dynamic panel data econometric model to understand the effect of loan recovery, write-off, non-performing loans and efficiency on the pre and after tax profitability of state-owned and private commercial banks in Bangladesh.
In this research, the following key questions will be investigated to identify the above-mentioned gaps in the light of the questionnaire survey and secondary data analysis. The key questions are as follows—
What are the effects of excessive credit growth on the long run credit quality?
What are the effects of cost of fund on non-performing loans both in the short and long run?
What are the determinants of non-performing loans from the perspective of bankers and borrowers of Bangladesh?
What are the comparative factors that differentiate the state-owned banks from the private commercial banks?
Historically Bangladesh had a low volume of non-performing loans, with a downward trend until the year 2011. From 2011 to 2018 however, NPLs showed a steep incline in the banking sector of the country. From there on as of Sep 2021, there has been a declining trend. Regardless, Bangladesh is still facing a severe problem in handling this large volume of non-performing loans, with the banking industry confronted by large amounts of irrecoverable money. By 2021 September, the gross NPLs in Bangladesh had reached a staggering BDT 1033 billion.
According to the Financial Stability Report 2017 by Bangladesh Bank, 54.08 percent of the gross total loan disbursement was inserted into the four major sectors of RMG and textiles, construction loans, commercial loans and agriculture.
Most NPLs occurred in the state-owned commercial banks and this trend did not demonstrate a slow-down till 2017. According to a field survey report by Bangladesh Bank, the state-owned commercial banks have contributed 47 percent of the overall non-performing loans from December 2016 to June 2017. During this same six-month period, the private commercial banks contributed 43 percent of the total NPL of the country. As of Sep 2021, state-owned banks have contributed 44% to the total non-performing loans of the banking industry. Private commercial banks on the similar manner have contributed almost 50% of the total NPLs of the banking industry.
It is true that other South Asian countries are also weighed down by the phenomenon of rising NPLs, though some of them have been able to tackle this issue by taking recourse to tighter laws and an efficient monitoring system. For example, India, Pakistan, Maldives and Sri Lanka have successfully brought their NPLs down significantly from the year 2011 to 2017 although their NPLs have been recently increasing from 2018. Despite the fact India and Bangladesh have shown positive sign in bringing down the NPL ratio from 2017 India, Bangladesh, Bhutan and Afghanistan are still struggling under the staggering burdens of non-performing loans.
A lot of research on NPLs has showed its detrimental effect on the economy of Bangladesh. A comparative study on non-performing loans in Bangladesh, Pakistan and India Waqas et al., 2017 showed that NPLs across the country is not only caused by macroeconomic factors, but also poor internal policies, lack of experience, steady and weak decision-making power and centralized managerial-control. Their findings showed the mean value of NPLs across Pakistan, India and Bangladesh were 13.1 percent, 2.9 percent and 6.8 percent, respectively. The study concluded that due to the higher variability and dispersion of the NPL amount in Pakistan, the default risk is higher in Pakistan. Bangladesh is also in a higher default position compared to India. The current trend of NPLs in Bangladesh too reflects these findings.
Figure 3.1 shows the comparative ratio of non-performing loans to total loans of the SAARC regions from 2011 to 2020. During the period of 2011 to 2017, the non-performing loans of Pakistan, Maldives and Sri Lanka has declined at a noticeable rate compared to the rising trend in Bangladesh. As of 2020, the NPL ratio of Sri Lanka, Bhutan, Afghanistan, Pakistan and Maldives the rate has been inclining for couple of years. In the same time period Banlgadesh and India have managed to maintain a declining trend.
Now if we glance towards the developed countries, we are met with a completely different scenario. For instance, despite the economic low in 2008, most of the 35 member countries of the OECD (Organization for Economic Cooperation and Development) showed a declining NPL rate for the period 2011–2020. Although the NPL ratio of some countries like Austria, Belgium, Greece, Italy, Portugal, Sweden and Turkey has inclined or fluctuated, the NPL ratio of this community in general has declined from 5.48 percent to 3.03 percent during the ten-year period from 2011 to 2020 (Figure 3.2).
Figure 3.1: Non-performing loan percentage (%) to total loans of the SAARC (South Asian Association for Regional Cooperation) member countries (2011-2020)
🔍 Tap to enlarge
Figure 3.1
Source: World Bank.
It has been observed from the World Bank data that Germany, United Kingdom and the United States, who are also the major exporting partners of Bangladesh, has shown great success in this regard by bringing down their NPL ratio largely within the period 2011–2020. By contrast, Bangladesh is faced with the consequences of a steep inclination in the non-performing loans during 2011-2018. The burden of rising NPLs among the banks in Bangladesh has shown some form of recovery in recent years but the overall recovery amount has not been satisfactory. For example, the NPL ratio of Bangladesh declined from 2018 to 2020 (figure 3.1). However, the total loans also increased at a high rate after that, so that it cannot be concluded that sufficient amount of loan was recovered during those years.
Figure 3.2: OECD (Organization for Economic Cooperation and Development) Countries
NPL 2011–2020 in percentage (%)
🔍 Tap to enlarge
Figure 3.2
Source: World Bank
Another way to approximate the loan recovery is by calculating the loans which are written-off by the banks. Up to June 2020, the total written-off loans stood at BDT 433 billion. An extra amount of BDT 3.4 billion write-offs were added in the year 2021 which put the total amount of loan write-off up-to September 2021 to BDT 436.4 billion. In Bangladesh, many banks are forced to write-off loans under political pressure and such influential higher-ups. Lots of bank officials and researchers have suggested that these staggering cases of NPLs can be resolved to a greater degree by strengthening the legal process with the money loan court. According to the policy of the Bangladesh Bank, loans are written-off after sufficient amount of provisions are made.
Banks take tax advantage from the Bangladesh Bank through these malleable processes, but the banks are still obligated to continue their recovery efforts. They have stressed the importance of the money loan court because the banks are required to file lawsuits in order to write-off specific loans. Many institutions and organizations have asked for the amendment of the Money Loan Court Act (2003), Bank Company Act (1991), the Negotiable Instrument Act (1881) and the Anti-Money Laundering Act (2012) for proper controlling of NPLs and the trend of writing-off loans.
Theoretical development
In an economy, there are those who have funds and those who are in need of funds. Financial (banking and non-banking) institutions play an important role in channeling the funds of the economy, with proper investigation, from the surplus group to the deficit group or the right user.
As mentioned earlier, banks lend money to the borrowers in the form of loan which is utilized by the borrowers to provide the banks with “cost of fund” and spread. For every loan, banks must keep sufficient amount of provisions prescribed by the Bangladesh Bank (Central Bank of Bangladesh) according to the category of loans also dictated by the Central Bank. After the general provision requirements have been met, if the banks have a valid concern for any loans to turn non-performing, they can keep extra provisions which are specifically called the provision for non-performing loans.
The definition of non-performing loans can vary from country to country but the general notion does not change completely. Broadly, loans on which the interest has not been paid for more than three months are classified as non-performing loans. They can be either gross or net. Gross non-performing loans are those from which the provisions have not been deducted, that is, the provisions are included in them. Net NPLs are those from which the provisions have been deducted.
Further, loans are generally classified as non-performing if they do not generate income for three months or more. In Bangladesh, loans are generally categorized into unclassified and classified parts. Unclassified loans contain standard loans and special mention account.
Non-performing loans are “financial pollutions” which can harm the economic condition of a country and the social welfare of the citizens. (Zeng, 2012) Non-performing loans are the amount of past due which cannot be paid within the agreed term, as well as the amount which is 90 days or past due (Festic et al., 2009). Although NPLs are sometimes considered as the expression of low quality of loans, this does not provide a complete perspective. The qualitative measure of the entire loan portfolio of banks also counts (Filip, 2013). In the context of Bangladesh, the Central Bank of Bangladesh has consistently published reports on the actual definition of NPLs and set the actual provision and capital adequacy limits for the banks.
Credit/long growth
Generally, the overall business flow and the performance of banks is hugely affected by the growth of loans and deposits at any point of time. The sanctioning of new loans is not generally possible without the growth of funds received through deposits, since the banks must maintain a certain amount of cash reserve ratio (CRR) and statutory reserve ratio (SLR) prescribed by the Bangladesh Bank.
Cash reserve ratio (CRR): CRR ratio is the proportion of deposit amount which the commercial banks are required to maintain as cash according to the directions of the Central Bank. This is an important tool used by the central bank to control money supply in the economy. When the central bank wants to increase money supply in the economy, it lowers the ratio which encourages the banks to give more loans and thus channelizes the money into the economy. In the fiscal year 2017, the cash CRR for the scheduled banks with the Bangladesh Bank was 6.5 percent on a bi-weekly basis provided that the CRR would not be less than 6 percent in any given day. CRR has been revised at 5.5 percent from 6.5 percent and minimum 5 percent on daily basis effective from 15 April 2018, according to a circular issued by the Bangladesh Bank. However, CRR ratio was set at 4 percent in April 2021.
Statutory liquidity ratio (SLR): SLR ratio is the proportion of deposits, which the banks must maintain with the central bank in the form of gold, cash, government approved securities or any other liquid assets. This is also a monetary tool used by the central bank to restrict the banks in channeling money into the economy as loans or investments. According to the guideline of Bangladesh Bank, conventional banks must maintain 13 percent, and Islamic shariah- based banks 5.5 percent of their total demand and time liabilities. However, this ratio may change subject to the policy of Bangladesh Bank.
The ADR (Advance Deposit Ratio) has increased to 87 percent from the existing 85 percent for conventional banks and 92 percent from the existing 90 percent for shariah-based Islamic banks by Bangladesh Bank. The revise rate effected from April 15, 2020. Setting aside the existing loans, the inclusion of every new deposit creates the possibility of loans to become good or non-performing. Every bank knowingly or unknowingly operates under the condition of the demand of loans and supply of funds. If there is any discrepancy in the proportion of loans and deposits, the risk exposure of banks change. Higher loans relative to deposits increase the risk exposure of banks. This is the risk posed by any sudden withdrawal by depositors. Higher loan-deposit ratio also indicates higher demand of loans relative to deposits for investment activities. This does not necessarily imply that higher demand of loans will result in higher return for banks. This may indicate that the politicized environment has created a demand, which would not have occurred under normal circumstances.
In general, the banking industry has been experiencing a declining rate of growth of loans since 2006 (figure 3.3). Since 2011 particularly— just after the share market crash—the loan growth rate declined tremendously. The reasons for this is obvious. Just before the share market collapse, huge amounts of loans were diverted into share market investments, which did not profit at all. Consequently, banks became cautious about disbursing loans in the years following the crash. Higher loan growth has become an even greater concern for banks in the last six to seven years owing to the risks of incurring bad loans. It also involves the decision to increase loans along with accumulation of higher deposits and higher cost of fund, which again poses serious risks for banks. However, banks sometimes venture beyond the norm and try to capitalize the higher deposits irrationally, which results in non- performing loans in the long run.
🔍 Tap to enlarge
Figure 3.3
🔍 Tap to enlarge
Figure 3.4
Source: Bangladesh Bank
When banks increase their credit growth, it does not necessarily imply that the loans will turn non-performing. Rather it is important to identify the time period when banks incline towards higher credit disbursement than usual. When the economy is experiencing growth, banks generally tend to increase their lending activity. The decision to lend higher than usual can have positive or negative results. Assuming all the borrowers have excellent credit worthiness, the decision to lend more than usual will bring huge earnings for the banks. But not all the borrowers are of equal status and more importantly it is not guaranteed that all the borrowers will be able to pay back regularly. Banks strive to maximize profit and they will try to capitalize every opportunity they come across. Therefore, the opportunity of lending more in good times can result in an increase in deposit collection with higher cost of fund. The opportunity to lend excessively in good times may not increase bad loans in the short run but if the economic growth is prevalent with high management inefficiency and corruption, loans can turn to non-performing in the long run. The previous section hinted at the rising cost of funds which is also one area of investigation in this study. The following section will provide the definition of cost of fund and the impact it can have on the lending rate which has the potential to influence the asset quality in the long run.
Cost of fund
In simple terms, “cost of fund” is the interest amount paid by financial institutions to depositors. In other words, it signifies the weighted average interest rate of interest-bearing liabilities of the financial institutions. These weighted average deposit rates are determined by the interest rate paid to depositors on financial products, including savings accounts and time deposits. Although the term “cost of funds” is often used with regard to financial institutions, most corporations are also indirectly affected by the cost of funds when borrowing. Cost of funds can be interest-bearing funds, and interest-bearing funds excluding the low-cost specific-purpose scheme funds.
The cost of funds is one of the most important input costs for a financial institution, since lower cost of fund will attract less depositors and higher cost of fund will attract more depositors. The rate at which banks collect fund affects the lending rate of the banks which ultimately determine the spread at which they operate. So one of the primary activities of banks is to strike a balance between the cost of fund and lending rate.
Cost of funds and net interest spread are conceptually key ways in which many banks make money. Commercial Banks charge interest rates on loans and other products that consumers, companies and large-scale institutions need. The interest rate that the banks charge on such loans must be greater than the cost of fund or funding cost. Deposits (often called core deposits) are a primary source of funding, typically in the form of checking or savings accounts, and are generally obtained at low rates. Banks typically need to finance long-term deposits through higher cost of fund unlike short-term deposits. As mentioned earlier, cost of fund can directly affect the lending rate of the banks, which has short and long-term consequences on the quality of loans. So understanding the effect of cost of fund on non-performing loan is very essential to know how the depositors and investor activity affect the quality of loans. In other words, how the price of deposits affects the loan quality in the short and long run.
Impact of cost of fund on the loan quality
The importance of understanding the impact of cost of funds on non-performing loans lies in the way the cost of fund operates in the economic system, to create noticeable fluctuations in the position of classified loans of the banks. As previously mentioned, the cost of fund can affect the lending rate but the opposite is also possible. Cost of fund can be influenced by the lending rate, monetary policy, liquidity crisis or change in the rate of national savings certificate. This bi-directional relationship between cost of fund and lending rate is part of this study.
In this context, some researchers have suggested that cost of fund or the deposit rates of the banks can influence the non-performing loans of the banks. Irungu (2013) argued that it is possible for banks to increase the lending rate and lower the cost of fund to widen the interest spread and thus maximize the profitability of shareholders. Sheefeni (2016) pointed out that the cost of fund and lending rate can be a monetary policy transmission mechanism in an economy. Amarasekara (2005) conducted some empirical studies to find that in some countries when monetary policy rates are inclining, retail lending rates respond quickly but the cost of fund or the deposit rate remain sluggish while the results are vice versa in the opposite scenario.
Regardless of the effect of monetary policy, this study attempts to find out the effect of the cost of fund independently on loan quality in the presence of real interest rate. The impact of cost of fund on the quality of loans can have long run implications due to the liquidity crisis in banks. If banks lend excessively there will be a shortage of funds, and to make up for the possibility of sudden withdrawal by the depositors’ banks may have to borrow more deposits at higher cost, which may affect the lending rate. A fact to note here is that the lending rate operates at float (which can change according to the market) and banks may raise the lending rate to cover the high cost of fund which can trigger delayed payments. This delayed payment can cause banks to keep provisions from their capital, which can affect their earnings as well. Therefore, there is a possibility that high cost of fund can affect the quality of loans and the earning of banks.
Impact of efficiency, credit quality, write-off and loan recovery on the profitability of state-owned and private commercial banks
The persistent growth of NPLs in the state-owned commercial banks over the last few years has triggered the need to analyze the reasons for such an upsurge. Compared to the private commercial banks, the rate at which the bad debts of the public banks have inclined has created concern among the economists and researchers. Consequently, the write-offs in the public banks have also been rising at an alarming rate. Surprisingly, the write-offs in the private commercial banks have also been in alignment to the write-offs of the public banks. Despite this alignment, the rate of loan write-off was higher in the public banks compared to the private banks from 2009 to September 2021. The subsequent table depicts the trend of the loan write-offs of these bank groups. It indicates that banks of different groups can become responsive to external stimuli to take off the bad debts from their books almost at the same time frame. The graph below to the left shows an interesting trend among these different bank groups in terms of cost inefficiency. From 2009 to onwards the cost for one taka income for public and private banks has been changing in opposing directions. The year when inefficiency decreased in private banks, the inefficiency quotient rose higher among the public banks. Since the profitability of both public and private banks has been declining while their inefficiency graph is moving in opposite directions each year, it can be assumed that the relationship between profitability and inefficiency between these two different bank groups will not match.
🔍 Tap to enlarge
Figure 3.5
🔍 Tap to enlarge
Figure 3.6
Source: Bangladesh Bank
Figure 3.5 shows that there is direct negative correlation between the profitability and cost efficiency of both the banking groups. The private banks are more prone to increased cost than public banks. Besides, the private banking industry seems to be extremely sensitive to operating efficiency compared to public banks. From the graph it is clear that the profit of the private bank increases when their inefficiency decreases. In the case of public banks, it is interesting to observe that when the cost relative to income increases, the profit also increases and vice versa. Figure 3.6 presents the overall scenario of the profitability and non-performing loans of the state-owned and private commercial banks in Bangladesh from 2009 to 2021. From the above graph, it is evident that the profitability of public banks is falling at a rapid pace with respect to the trend of private banks. Overall, the trend of bad debts of both types of banks show a similar pattern from 2009 but the bad debts of public banks inclined at a faster rate from 2012 compared to the private banking sector. The positive sign is that both state-owned and private commercial banks have managed to maintain a declining NPL ratio from 2018 to 2021. The general condition of both the banking groups are not so bright in terms of bad debts but the condition of the public banks are much worse compared to that of the private banks. From the above graph, it can be well correlated that as bad loans or non-performing loans to total loans and advances increase, the profitability of both banking groups take a hit in income in general.
Figure 3.7 shows the relationship between Return on Asset (ROA) and the loan write-off of the public and private commercial banks of Bangladesh from 2009 to September 2021. The relationship reveals that the effect of loan write-off is clearly different for these banking groups. For most cases from 2009, the relationship between profitability and loan write-off has been negative for private commercial banks but positive for state-owned commercial banks. This indicates that when the private banks are writing off loans which have been non-performing for some time, the profit declined. For public banks, the positive relationship reveals that if the state-owned banks are clearing off loans from the books their profit was increasing. Clearly, the burden of excessive non-performing loans is extremely noticeable for public banks compared to the private banks.
Figure 3.7: Comparison of the ROA and loan write-off of the state-owned and private commercial banks
(2009-September 2021)
🔍 Tap to enlarge
Figure 3.7
Source: Bangladesh Bank
These different relationships and trends between the public and private banks create the theoretical basis for analyzing the correlation between profit and different variables related to non-performing loans.
Research questions
What are the effects of excessive credit growth on the long run credit quality?
What are the effects of cost of fund on non-performing loans both in the short and long run?
What are the determinants of non-performing loans from the perspective of bankers and borrowers of Bangladesh?
What are the comparative factors that differentiate the state-owned banks from the private commercial banks?
Research hypotheses
H1: There is a long-term relationship between loan growth rate and non-performing loans.
H2: There is a long-term relationship between cost of fund and non-performing loans.
H3: There is a long-term relationship between lending rate and non-performing loans.
H4: There is a negative relationship between efficiency and the profitability of the banks.
H5: There is a negative relationship between market power and non-performing loans.
H6: There is a negative relationship between GDP and non-performing loans.
Cooper et al. (2003) identified research design as the process or mechanism of focusing on the researcher’s perspective for the intention of a specific study. Kotzar et al. (2005) described research design as the plan and structure of investigation and the process in which researches are put together. Leedy and Ormrod (2005) stated that research methodology is a means of extracting meaningful sense from data.
Nature of the study
The nature of this study is of both qualitative and quantitative. For quantitative analysis, secondary data has been collected from the annual report of the respective banks. The quantitative analysis related to the determinants of non-performing loans has been done on a panel dataset of 16 conventional commercial banks of Bangladesh. It has been conducted through a questionnaire (attached in the appendix) survey based on the interviews of bankers and borrowers. In addition, macroeconomic data has been collected from the annual report of Bangladesh Bank and the World Bank database.
Moreover, the comparison between state-owned and private banks has been done on a panel dataset of 5 public banks and the above-mentioned 16 private banks for the time period of 2009 to 2017. For the identification of comparing factors between the state-owned and private banks, another questionnaire (attached in the appendix) survey has been done with the same respondents.
Population size
Currently, there are 66 banks in Bangladesh out of which 61 are scheduled banks under the supervision and affiliation of Bangladesh Bank (figure 1.1). During the research period there were 64 schedules banks in Bangladesh. The recently added banks has raised the number of local private commercial banks to 43. Out of these 43 private commercial banks, 33 of them are conventional PCBs and the other 10 are Islami shariah based. The subject of this thesis is the analysis of the conventional (interest based) private commercial banks and state-owned commercial banks. So the population size for this study is the 33 conventional private commercial banks and 6 state-owned banks.
Sample size
A total of 16 publicly listed conventional private commercial banks has been randomly selected from 33 conventional private commercial banks for this research. For this reason, the banks in Bangladesh have been put into clusters of different banking groups. From that cluster of banks, conventional banks were selected at random. The sample size is about 49 percent of the total conventional private commercial banks in Bangladesh. The time frame has been selected from 2006 to 2017 firstly, for constructing the determinants of non-performing loans, and secondly for formulating the long-term links between loan growth and cost of fund with the non-performing loans of the banks. For the comparison between the state-owned and private commercial banks 5 state-owned commercial banks (SCBs) have been selected at random along with above-mentioned 16 private banks for the time period of 2009 to 2017. Thus, the sample size for the comparison is about 83 percent.
Sampling design
A random sampling method has been used from a sample size of 33 conventional private commercial banks. During research period, 64 scheduled banks had been classified into different clusters or groups from which a sample of 16 private commercial banks have been selected for the analysis. Five state-owned banks have been randomly selected for the purpose of comparison with private commercial banks.
Data collection
For the empirical analysis, quantitative data has been collected from the respective annual reports of the banks and from the website of Bangladesh Bank. As mentioned earlier, the data has been collected for a particular time frame for each sample bank. This is known as panel data or categorical data. For the primary data, 100 respondents were questioned through face-to-face interview, emails and phone calls. Out of 100 interviewers, 75 were bankers and 25 were borrowers. For the comparison, the qualitative analysis has been done with the above-mentioned 100 interviewers.
Data analysis
Both field survey and secondary data have been considered for analysis. For the quantitative and empirical analysis, the GMM technique has been used as proposed by Arellano and Bond (1991). LIKERT scale has been used to formulate the questionnaires. Stata, EViews and SPSS software were used to analyze the depth of different data source. The analysis of the determinants of non-performing loans along with the comparison between state-owned and private commercial banks have been conducted with the help of the above-mentioned software.
Qualitative approach
Qualitative research is an exploratory analysis, which is used to gain an insight of the underlying reasons, opinions and motivations to develop ideas, gaps or hypotheses for potential quantitative research. Qualitative research is used to generate thoughts and important missing gaps which may appear in quantitative analysis. There are some common methods which include focus groups or other individual face-to-face interviews to collect data for further analysis and generate a better understanding for research. Qualitative data is that data which is involved in the understanding of the complexity, detail and context of the research subject, often consisting of texts, such as interview transcripts and field notes, or audiovisual material. Hox, J. J., and Boeije, H. R. (2005)
Quantitative approach
This particular approach is used to make numerical understandings of any problem by analyzing data which is generally transformed by using statistical methods and analysis. Data are those which can be described numerically in terms of objects, variables and their values (Hox and Boeije, 2005). In the research paradigm, a mixed approach combining qualitative and quantitative method of data collection is currently in use (Creswell and Clark, 2007). Quantitative research is used to formulate facts and uncover patterns from measurable data. This kind of data collection includes online surveys, paper surveys, mobile surveys, face- to-face interview, etc.
Mixed approach
A mixed research approach is generally the combination of the qualitative and quantitative approach. This method is used to ask questions about the research and make a numerical attempt to make sense of the underlying research point or subject. Valerie Caracelli mentioned in his studies that a mixed method study is one that fully juxtaposes or combines methods of different types—qualitative and quantitative. The method helps to provide a deeper understanding of the phenomenon of interest (including its context), and gain greater confidence in the conclusions generated by the evaluation study. Many researchers have given different definitions of the mixed research approach. For example, Huey Chen in his study mentioned that the mixed approach is a systematic integration of quantitative and qualitative methods for the purpose of obtaining a fuller and deeper understanding of a phenomenon. In its pure form, the mixed method can be integrated in such a way that qualitative and quantitative methods retain their original structures and procedures. Alternatively, in the modified form of the mixed approach, the qualitative and quantitative methods can be adapted, altered, or synthesized to fit the research and cost situations of the study.
Econometric model
An econometric model is one of the tools economists use to forecast future developments in the economy. Interestingly, econometric model consists of a deterministic part and a random part. There are system atic phenomena which can be described through empirical analysis and there are random components which are allowed to work under probability distribution. Greene (2003) mentioned that an econometric model consists of endogenous variables, exogenous variables and disturbances (error component). Endogenous variables are dependent variables that can be described through another variable within the model. On the other hand, exogenous variables are independent variables that are independent of any other factors.
Primary data is the original data collected for a research goal and secondary data is the data that was originally collected for a certain purpose and reused for another research. Data sets collected by the university-based researchers are often archived by the data archives; these are organizations set up chiefly for the purpose of releasing and disseminating the secondary data to the general community. On the other hand, most of the secondary data sets contain quantitative data; that is, the information consists of studied objects whose characteristics are coded in variables that have a range of possible values. A qualitative database consists of documents, audiocassettes, or video-cassette tapes, or the transcripts of these tapes (Hox, J. J., and Boeije, H. R., 2005).
Panel data has been used for quantitative analysis and ordinal data has been used for qualitative analysis. Panel data refers to any data set with repeated observations over time for the same individuals (Arellano, 2003). Ordinal level data are represented by sets of labels or names (high, medium, low) that have relative values which can be ranked or ordered (Lind, 2000).
Primary data
Primary data sources of information are the unique work of researchers without interpretation or pronouncements that represents an official opinion or positive. On the other hand, secondary data are interpretation of primary data (Cooper, D. R, et al., 2006). The latter also mentions in their book that primary data source is always the most authoritative because the information has not been sifted or interpreted by a second party. Some of the internal sources of information mentioned in their books are inventory records, personnel records, purchasing requisitions forms and statistical process control charts and similar data. Primary data sources can be different internal sources like marketing documents and databases, operations document and database, information from the human resource management database, financial documents and database and management documents.
Source
Primary data source has been collected from the questionnaire given to borrowers and employees of banks. Their direct comments and perception about problems have been highlighted and considered as the most direct and deep source of primary information. Bankers involved in corporate business, credit risk management, special asset management division and credit evaluation were interviewed. Different levels of management were included in the questionnaire process. In the case of borrowers, managing directors and chief financial officers were interviewed.
Technique
Primary data is collected by questioning the bankers and borrowers about non-performing loans. Banks provide loans in many sectors such as corporate, retails, agricultural, SME, industries and others. This primary data has been collected by questioning the clients of different sectors. In this research, the five-point LIKERT scale has been used to measure the reasons for inclining non-performing loans and compare the performance of private commercial banks and state-owned banks, from the perspective of bankers and borrowers. The scale is as follows:
1 = strongly disagree;
2 = disagree;
3 = neutral;
4 = agree; and
5 = strongly agree.
Variables used in the qualitative analysis
Variables used in the qualitative analysis have been divided into two parts. One part includes the variables used in finding the determinants of non-performing loans through questionnaire survey. Another part includes the variables used in comparing state-owned and private commercial banks through field survey data.
Variables used in finding the determinants of non-performing loans:
Table 5.1: Variables used in the qualitative analysis
📊 Data Table↔ Scroll horizontally to view full table
Table 5.1: Variables used in the qualitative analysis
Higher energy crisis can result in poor business performance and high cost will result in higher non-performing loans (NPLs)
Budgetary expenditure
BE
–
Higher budgetary expenditure will be more business conducive,
decreasing NPLs.
Political instability
PI
+
Higher political instability will hinder daily business activity and delay regular procedure leading to higher bad loans.
Number of banks
BANK
+/ –
Higher banks can lead to more management inefficiency with less skilled manpower increasing the scope for NPL. On the other hand, higher banks can be helpful for tackling NPL if the banks are kept free from political influence and nepotism.
Ease of doing business
EDB
+
A business-friendly environment generally lowers the occurrence of NPL.
Merging of the banks
MER
+/ –
NPL can be reduced through merging if the effective skill and management is utilized by sharing. Otherwise no impact.
Exchange rate
ER
+/ –
May vary in either way if banks are heavily exporting or importing.
Unemployment rate
UR
+
Bankers perceive that higher the unemployment rate, lower will be the income and the inability to repay loans thus will result in higher NPL.
Inflation rate
IR
+/ –
Higher inflation can increase NPL if the price of raw materials or price of factor of productions goes up. If the income of the borrowers goes up with inflation, NPL may decline.
GDP growth
GDP
–
Normally higher GDP growth results in lower NPL.
Bank profitability
PRO
–
Banks with higher profit are more efficient in controlling loans and cautious about loan sanctioning, so NPL should decline with higher profit.
Management efficiency
ME
–
Strong management should reduce NPL
Loan monitoring
LM
–
Better loan monitoring can foresee and predict future losses, thereby lowering the number of bad loans.
IT and MIS
IT
–
Better technology for open-information access to every banker to monitor loan status with proper loan monitoring can reduce NPL.
Lending rate
LR
+
Higher lending can create pressure on borrowers and increase NPL on account of the floating rate.
Cost of fund
COF
+
Higher cost of fund can decrease the profit of banks, leading to banks passing the burden on the borrowers herby increasing NPL.
Banking corruption
BCOR
+
High corruption or in fact any corruption increases NPL.
Loan evaluation
LE
–
Better loan evaluation reduces the chance of NPL.
Collateral
COL
+/ –
Higher collateral may or may not reduce NPL.
Borrower’s honesty
BOHO
–
The performance of the loans depends a lot on the honesty of borrowers. So if borrowers divert funds without consent, they can increase NPL.
Bankers who were involved in the corporate business, credit risk management, credit monitoring, retail and SME business positions were interviewed. Different levels of management were also included in the questionnaire process to the borrowers.
Descriptive statistics
Table 5.2: Bankers’ perception on the determinants of non-performing loans (NPLs)
Bankers who were involved in corporate business, credit risk management, credit monitoring, retail and SME business positions were interviewed. Different levels of management were also included in the questionnaire process.
Descriptive statistics
In this part, the average, median and the dispersion statistics has been pre sented based on the LIKERT scale of agreement. The average or mean value in the following tables represents the average agreement level (strongly disagree to strongly agree) of each of the comparing factors. The standard deviation shows how each respondent’s agreement level varies from the average level.
Table 5.9: Vriables used in the qualitative analysis of the comparison between the state-owned and private commercial banks
Non-performing loans in state-owned commercial banks (SCBs) is more severe than it is in private commercial banks (PCBs).
3
1
11
15
70
4.48
5.00
0.95
100
2
Political influence increases NPLs of SCBs much more than it does of PCBs.
4
9
32
7
48
3.86
4.00
1.23
100
3
Bangladesh Bank is less strict towards SCBs than PCBs.
2
9
10
68
11
3.77
4.00
0.84
100
4
Rescheduling of NPLs is greater in SCBs than
in PCBs.
11
9
23
14
43
3.69
4.00
1.39
100
5
Financial statements of SCBs are less reliable
than those of PCBs.
12
10
21
15
42
3.65
4.00
1.42
100
6
Cost inefficiency has significant effect on the profitability of SCBs than that of PCBs.
9
6
15
13
57
4.03
5.00
1.34
100
7
The effect of NPL on the profitability is more severe in SCBs than it is in PCBs.
5
3
12
10
70
4.37
5.00
1.13
100
8
Loan write-off has more effect on the profit of PCBs than of SCBs.
4
16
15
21
44
3.85
4.00
1.26
100
9
Loan recovery has greater effect on the profitability of SCBs than of PCBs.
11
16
17
13
43
3.61
4.00
1.45
100
10
Capital injection is more
in SCBs than in PCBs.
2
5
14
29
50
4.20
4.50
0.99
100
11
Willful defaulters are more interested in taking loans from SCBs than from PCBs.
10
6
13
13
58
4.03
5.00
1.37
100
12
SCBs are more aggressive towards branding and marketing of their products than PCBs.
10
4
12
23
51
4.01
5.00
1.31
100
13
Corruption is more prevalent in SCBs than it is in PCBs.
9
3
5
38
45
4.07
4.00
1.20
100
14
SCBs are more reluctant to advance technology than PCBs.
5
9
9
19
58
4.16
5.00
1.21
100
15
Banker are less bothered with the management of rising NPLs in SCBs than in PCBs.
6
14
13
23
44
3.85
4.00
1.29
100
16
Loans against letter of credit (inland) are more likely to default in SCBs than in PCBs.
7
7
14
26
46
3.97
4.00
1.23
100
17
It is more difficult for Bangladesh Bank to monitor SCBs than PCBs.
13
10
20
20
37
3.58
4.00
1.41
100
18
Private Banks provide better customer service compared to the SCBs.
9
5
12
31
43
3.94
4.00
1.25
100
Source: The calculation is based on the field survey statistics of the researcher, 2018
From the previous table, the mean or average agreement level can be measured for each factor. Almost all of the respondents agreed that the severity of bad debts is more in state-owned commercial banks (SCBs) than in private commercial banks (PCBs).
Table 5.10: Percentage of respondents on the factors for comparison between state-owned and private commercial banks
📊 Data Table↔ Scroll horizontally to view full table
Table 5.10: Percentage of respondents on the factors for comparison between state-owned and private commercial banks
Strongly
disagree
Disagree
Neutral
Agree
Strongly
agree
1
2
3
4
5
1
Non-performing loans in state-owned commercial banks (SCBs) is more severe than it is in private commercial banks (PCBs).
3%
1%
11%
15%
70%
2
Political influence increases NPLs of SCBs much more than it does in PCBs.
4%
9%
32%
7%
48%
3
Bangladesh Bank is less strict against SCBs than PCBs.
2%
9%
10%
68%
11%
4
Rescheduling of NPLs is greater in SCBs than in PCBs.
11%
9%
23%
14%
43%
5
Financial statements of SCBs are less reliable than those of PCBs.
12%
10%
21%
15%
42%
6
Cost inefficiency has significant effect on the profitability of SCBs than that of PCBs.
9%
6%
15%
13%
57%
7
The effect of NPL on profitability is more severe in SCBs than it is in PCBs.
5%
3%
12%
10%
70%
8
Loan write-off has more effect on the profit in PCBs than on the profit of SCBs.
4%
16%
15%
21%
44%
9
Loan recovery has significant effect on the profitability of SCBs than PCBs.
11%
16%
17%
13%
43%
10
Capital injection is more in SCBs than it is in PCBs.
2%
5%
14%
29%
50%
11
Willful defaulters are more interested in taking loans from SCBs than from PCBs.
10%
6%
13%
13%
58%
12
SCBs are more aggressive towards branding and marketing of their products than PCBs.
10%
4%
12%
23%
51%
13
Corruption is more prevalent in SCBs than it is in PCBs.
9%
3%
5%
38%
45%
14
SCBs are more reluctant to advance technology than the PCBs.
5%
9%
9%
19%
58%
15
Bankers in SCBs are less bothered with the management of rising NPLs than bankers in PCBs.
6%
14%
13%
23%
44%
16
Loans against letter of credit (inland) are more likely to default in SCBs than in PCBs.
7%
7%
14%
26%
46%
17
It is difficult for Bangladesh Bank to monitor SCBs than PCBs.
13%
10%
20%
20%
37%
18
Private Banks provide better customer service compared to SCBs.
9%
5%
12%
31%
43%
Source: The calculation is based on the field survey statistics of the researcher, 2018
Around 80 percent of the respondents agreed that capital injection is much more in public banks than it is in private banks. Factors like corruption, use of technology, willful defaulters and default against L/C acceptance (inland) were the main agreement factors in comparing the public banks with private banks. In the case of loan recovery, which was previously written-off, there were some disagreements about the recovery being less in public banks. People who disagreed or strongly disagreed was 27 percent, according to whom that it was possible for the loan recovery to be much higher in public banks as well. It could be that the respondents may have referred to a particular year when the recovery of written-off loans were much higher than the recovery in private banks. Many have suggested that the financial statements of the public banks are not very reliable compared to private banks. However, most respondents did not completely agree to this. In terms of branding and marketing, majority of the reviewers mentioned that the public banks did not promote their products aggressively, as the private banks did. There were mixed reviews in terms of management efficiency and the overall efficiency from the respondents. These mixed reviews have been further analyzed with the secondary data to better understand the effect of efficiency, loan recovery and loan write-off.
Secondary Data
Secondary sources of data are the interpretation of the primary data (Cooper et al., 2006). They mentioned in their books that one of the secondary sources of information is the investors’ annual report.
Source
Secondary data of banks have been collected from the audited financial reports of the respected banks. A sample of 16 publicly listed banks have been selected from whom 12 years of data has been used. The data was collected on an annual basis. Macroeconomic data has been collected from Bangladesh Bank, World Bank and the International Monetary Fund. The amount of total NPL and the ratio of gross NPL to total loan have been taken from the website of Bangladesh Bank. For a comparative analysis, the audited annual report of the public banks was also used. The comparison involved five state-owned commercial banks out of six, which were randomly selected for of the purpose of analysis.
Method
The secondary data has been analyzed through the dynamic panel data method. A panel unit root test has also been conducted for prediction purpose. The Sargan test, first order autocorrelation and second order autocorrelation test has also been performed. The GMM technique has been applied in the comparative analysis with the above- mentioned tests to identify the nature of the secondary data. Panel unit root test has also been performed on the different variables for the comparative analysis.
Variables used in the quantitative analysis
Variables used in finding the determinants of
non-performing loans
Table 5.11: Variables used in the “determinants of non-performing loans”
📊 Data Table↔ Scroll horizontally to view full table
Table 5.11: Variables used in the “determinants of non-performing loans”
Variables
Abbreviation
Definition
1
NPL ratio
NPL
Total non-performing loans divided by the total loans and advances
2
Real lending rate (RLR)
RLR
Industry nominal lending rate –inflation rate
3
Natural log of
Per capita GDP
ln(PCG)
Natural log of real GDP divided bythe natural log of total population
4
Loan growth rate
LGR
Average yearly growth of loan at which it inclines
5
Loan growth rate– yearly average
LGR-
YIAVG
Difference between individual bank’s loan growth rate
6
Cost of fund
COF
Weighted average rate of different deposits collected directly from the annual report
7
Real Cost of fund
RCOF
Inflation-adjusted cost of fund
8
Average lending rate
ALR
Interest income divided by the total outstanding loan and advances
9
Real Average lending rate
RALR
Average lending rate minus inflation rate
10
Market power
MP
Natural log of total loans of individual banks divided by the natural log of loans of the banking industry
11
Size
SIZE
Natural logarithm of total assets
Non-performing loans: According to World Bank, the most well acknowledged threshold or limit for classifying a loan as non-performing is when obligations related to the loan become over 90 days or more. The IMF’s Financial Soundness Indicators (FSIs) also defined a loan as non-performing when the principal or interest amount is past due over 90 days. Regardless of the time limit of 90 days for a loan to be considered as non-performing, banks may have sufficient information before that time period about the condition of the loans. It should be noted that the limit of 90 days may be extended by banks to comply a grace period which is granted to the borrowers for special purposes. Therefore, the time limit for a loan to stay performing may vary with region and types of loans (e.g., working capital versus mortgages). The financial stability of an economy is reflected by the banks’ non-performing loans because this category of loan exhibits the asset quality, credit risk and efficiency in the allocation of resources to productive sectors (Rajan and Dhal, 2003).
Loan growth rate: This is the average rate at which loans grow within a year. Banks provide different categories of loans for different time period. Moreover, banks have large portion of funds tied to FDR and other long-term investments so loans can turn to non-performing after a long time—after having performed till even the very end of maturity, so the use of lagged loan growth in this research for understanding the effect of future non-performing loans is of great importance and relevance. Jesus and Gabriel (2006) used data over 1984 to 2002 and found a negative relationship between lagged 4 loan growth and the current non-performing loans. Their analysis also revealed that lagged GDP growth had negative significant relationship with non-performing loans. They also considered the effect real interest rate that might affect cost of fund and general lending rate. They found that lagged real interest rate had a significant positive impact on non-performing loans. This research considers using up to four years of lagged lending rate similar to Jesus and Gabriel (2006) in understanding its effect on the non-performing loans of private commercial banks. The study expects a positive association between lagged loan growth and the current non-performing loans.
Real average lending rate of banks: This is the rate at which banks lend money to the borrowers. This rate is different for different types of loan category and terms. Banks do not provide the exact figure of this number, so a general approach has been used in this paper for calculating average lending rate. Vogiazas and Nikolaidou (2011) used the average interest rate of credit institutions charged on loans to non-financial corporations and households as a proxy for interest rate on loans.
This research uses the following ratio as the measure of the aggregate lending rate of banks. This similar approach was used by Ahmad and Bashir (2013) who used the ratio of interest expense and total deposit as the proxy of deposit rates as one of the determinant factors of non-performing loans. This study expects different results from the lagged lending rate.
Many existing literature leans toward the use of lagged lending rate in understanding the long-term impact of interest rates. Louzis et al. (2012) found a positive relation between non-performing loans and lagged real lending rate at 10 percent significant level for consumer loans. They also used the macroeconomic real lending rate and found when economic lending rate (inflation-adjusted) inclines, non-performing loans also incline significantly. P. Abid et al. (2014) used one and two periods of lagged real lending rate of individual banks and found significant positive relationship with non-performing loans. Adebola et al. (2011) found long run impact of average lending rate on the condition of non-performing loans.
We consider using both inflation-adjusted rate and average rate similar to Khemraj and Pasha (2009). This paper expects to find a positive association between real interest rate and non-performing loans.
Cost of fund: Cost of fund is the rate at which depositors or investors put their money in the bank. In other words, this is the rate at which banks collect fund from the depositors other than equity. Normally, cost funding can be short-term, savings, long-term and even different borrowing rates. So in this paper weighted average of cost of fund has been used provided by the annual reports of the banks. Munialo (2014) used the data from 43 commercial banks of Kenya for the time period of 2009 to 2013 on a yearly basis and found positive association between cost of fund and non-performing loans. The paper concluded that when cost of fund went up, the banks raised the lending rate to maintain their earnings and as a result confronted with higher non-performing loans. This study expects to find a positive relationship between cost of fund and non-performing loans.
Bank size: Bank size is measured by taking the natural logarithm of total assets. Researchers have used this variable to determine risk and the total area in which non-performing loans takeplace. Existing literature shows different result regarding the impactof size on non-performing loans. Waqaset al. (2017) found a negative relationship between size and non-performing loans similar to Louzis et al. (2012). Other empirical research shows a positive correlation between size and quality of loans (Chaibiet al., 2016; Abid et al., 2014). This study expects to find mixed results regarding bank size.
Market power: Existing literature have used the loans of individual banks to total loan of banking industry as a proxy of market power which tends to change over time and portrays the effort of banks in capitalizing their position in the market place. Ahmad and Bashir (2013) found insignificant association between market power and non-performing loans. This ratio is particularly important because it captures all the banks’ effort relative to the individual effort of the selected banks. Rising value of this ratio indicates that banks are competing for higher loans. This is a good thing as long as every bank struggles to get loans. This study expects to find a negative association between market power and non-performing loans.
Per-capita GDP: Although some researchers have used per capita GDP as a measure of economic growth, the effect of GDP growth rate in many literature has found to be both positively and negatively related to NPLs in a significant manner. In general, the relationship between economic growth and non-performing loans have produced similar results which is when economic growth rises the bad loans relative to total loans also deteriorates. However, some researchers have used lagged GDP growth and found different answers.
For example, Beck et al. (2013) used both current years and one-year lagged GDP growth and found that current year’s GDP growth has a significant negative relationship with non-performing loans which is expected; but found a positive significant relationship between lagged GDP growth rate and non-performing loans which they suggested was due to the fact that in boom periods banks lend excessively which results in NPLs. So according to them, loose credit standard policy in economic prosperity increases non-performing loans in the long run. They also suggested that the sum of lagged and present coefficient of the GDP growth is negative which indicates an overall negative relationship among GDP growth rate and non-performing loans. This finding is contrary to the findings of Klein. N. (2013) who found a negative link between lagged real GDP growth with non-performing loans.
Louzis et al. (2012) found a significant negative link between one and two period lagged GDP growth rate and non-performing loans. They mentioned that a slowdown in the economy results in higher bad loans and when the economy grows, non-performing loans also decline. Makri et al. (2014) found no significant lagged relationship between lagged GDP growth and non-performing loans but found a negative link with the current GDP growth at 10 percent significant level.
This paper considers using the per capita GDP as a measure of economic growth similar to (Saba et al., 2013; Fofack, 2005; Gonzalez-Hermosillo et al., 1997) who found a negative relationship between bad loans and per capita GDP. This study hypothesizes to find a negative association between GDP and non-performing loans.
Real interest/lending rate: Real interest rate is the inflation-adjusted rate at which loans are received from financial institutions. Khemraj and Pasha (2009) constructed this variable for each bank by subtracting the inflation rate from the weighted average lending rate of individual banks. They portrayed this variable as bank-specific rather than macroeconomic. Louzis et al. (2012) found significant positive relation between lagged real lending rate and non-performing loans. They concluded that banks refinance consumer loans during boom periods and also renegotiate debt term and pay off with the corporate world. Washington (2014) also found positive relationship between real lending rate and non-performing loans. They suggested that higher real interest rate increases non-performing loans because financial institutions engage in trading at floating rate which can be very much different from the initial rate if the rate fluctuates. Jesus and Gabriel (2006) also found a significant positive link between non-performing loans and lagged real interest rate. Abid et al. (2014) found a positive significant relationship between non-performing loans and lagged real interest rate. Waqas et al. (2017) found a positive significant relationship between non-performing loans and real interest rate. Although the effect of lending rate can have negative consequence on NPL, this paper hypothesizes to find a positive link between real lending rate and non-performing loans.
Sample Size
Sample size of the banks for the determining factors of NPL constitutes 16 private commercial banks out of 33 conventional private banks in Bangladesh. It was indicated earlier that banking industry of Bangladesh comprises 64 scheduled banks out of which 41 are local private commercial banks. Out of 41 local private banks eight are Shariah based banks and the rest 33 are local conventional non-Shariah based banks. The sample size in this part of the study uses 16 local conventional private conventional banks out of 33 local conventional private commercial banks.
Descriptive statistics
Table 5.12: Descriptive statistics on the variables related to the “determinants of NPL”
📊 Data Table↔ Scroll horizontally to view full table
Table 5.12: Descriptive statistics on the variables related to the “determinants of NPL”
Variable (2006–
2017)
Variation
Mean
Std. Dev.
Min
Max
Observations
NPLR
Overall
4.14%
1.66%
0.82%
8.68%
N = 192
Between
0.94%
2.84%
6.08%
n = 16
Within
1.39%
1.04%
8.33%
T = 12
Real lending
rate
Overall
4.64%
1.67%
0.75%
10.44%
N = 192
Between
0.76%
3.26%
6.46%
n = 16
Within
1.50%
2.12%
9.36%
T = 12
Per capita
GDP (Ln)
Overall
5.08%
0.08%
4.96%
5.21%
N = 192
Between
-
5.08%
5.08%
n = 16
Within
0.08%
4.96%
5.21%
T = 12
Loan growth
rate
Overall
21.65%
12.33%
-12.99%
65.98%
N = 192
Between
3.44%
17.22%
28.53%
n = 16
Within
11.87%
-11.62%
59.10%
T = 12
LGR_
YIAVG
Overall
0.00%
10.39%
-36.68%
42.29%
N = 192
between
3.44%
-4.42%
6.88%
n = 16
within
9.84%
-35.32%
35.41%
T = 12
Cost of
fund
overall
8.53%
2.01%
4.08%
13.67%
N = 192
between
1.48%
5.86%
10.75%
n = 16
within
1.41%
4.68%
11.50%
T = 12
Real cost
of fund
overall
1.2%
1.9%
-3.8%
6.4%
N = 192
between
1.5%
-1.4%
3.4%
n = 16
within
1.2%
-2.6%
4.3%
T = 12
Average lending
rate
overall
11.94%
2.05%
7.46%
17.24%
N = 192
between
0.76%
10.57%
13.77%
n = 16
within
1.91%
7.67%
16.56%
T = 12
Real average lending
rate
overall
4.64%
1.67%
0.75%
10.44%
N = 192
between
0.76%
3.26%
6.46%
n = 16
within
1.50%
2.12%
9.36%
T = 12
Market power
(Ln)
overall
0.54%
0.05%
0.36%
0.63%
N = 192
between
0.03%
0.48%
0.59%
n = 16
within
0.04%
0.41%
0.63%
T = 12
Total asset
(Ln)
overall
9.36%
0.69%
7.65%
10.51%
N = 192
between
0.26%
8.90%
9.74%
n = 16
within
0.64%
7.93%
10.48%
T = 12
Source: Author’s own calculation from collected data.
The non-performing loans to total loans and advance ratio above has lower “between variations” than “within variation”. This indicates that the non-performing loans of the industry sometimes move in the same direction. The within variation is higher indicating that the change of bad loans of these banks from year to year is not homogenous. The above table shows something interesting about the cost of fund. Interestingly, all the variables including the average lending rate has less between variations than within deviation. However, the cost of fund shows more variation between banks than variation within individual banks for the time frame of 2006 to 2017. This indicates that for some reason the cost of fund or the funding cost of these banks varies greatly depending on banks not just only on macroeconomic factors. If macroeconomic factors were the only reason for the variation of cost of funds, than the variation within the bank would have been higher than the variation among banks. Higher deviations between banks indicate that bank-specific factors play a significant role in determining the cost of funding. One bank-specific factor that could explain this high variation among banks is the deposit schemes of these banks. It is not as if the products that they are offer the depositors are the same. They may have different schemes with different rates that contribute to these variations. If deposit mix is one of the bank-specific factors for the variation of cost of fund among these banks, then the lending rate must also vary according to the deposit mix, since banks set the lending rate based on the type of deposit they collect.
Another interesting result from the table above is the variation in size of these banks. The higher within-variation suggests that these banks have grown at a greater rate over the year. But the lower between-variations suggests that due to intense competition no particular bank has capitalized the market. Similar conclusion can be drawn from the statistics of the market power (individual bank’s loans to the loan of the banking industry). Higher within-variation than between-variation suggests that banks were competing for market shares which were more than any particular bank retaining the same share of the market. Higher competition among all the banks particularly, the participation of all the banks equally, can narrow down the effectiveness of any particular type of bank or group of banks. There are some policy implications here that are simple yet effective. Recommendations based on these findings can be found in the recommendation chapter.
Figure 5.1 shows that loan growth in the banking sector is declining gradually. The variation among the loan growth rate is greater indicating that different banks work under different management policies. The variation was greater between 2006 and 2011 but banks seem to have been conservative in the lending policy after 2011. This explains the lower variability in the loan growth rate among banks between 2012 and 2017.
Figure 5.1: Loan growth rate of the selected 16 private commercial banks (2006–2017)
🔍 Tap to enlarge
Figure 5.1
Source: Annual reports of respective banks
Figure 5.2 portrays the rising non-performing loans in the private banking sector. Overall, there is a greater variability in the data for almost all the years. This indicates that banks have different non-performing loans to total loans for different bank characteristics. In 2011, the ratio for all the banks were in some form of alignment.
Figure 5.2: Non-performing loans to total loans of the selected 16 private commercial banks (2006–2017)
🔍 Tap to enlarge
Figure 5.2
Source: Annual reports of respective banks
If we look at the 16 banks cost of fund and average lending rate in figures 5.3 and 5.4, we will see that both fluctuate the same way so it can be inferred that there is a very good correlation between the cost of fund and average lending rate. But if we note each year’s rates we see that the variation among the cost of funds for each does not match the variation of lending rate. Lending rate for the respective bank’s cost of fund is very much narrow. This is because banks are much more sensitive to a change in lending rate than to a change in the cost of fund. For higher competition and keeping customers at hand, the lending rate has less variance.
Figure 5.3: Cost of fund of the selected 16 private commercial banks (2006–2017)
🔍 Tap to enlarge
Figure 5.3
Source: Annual reports of respective banks
On the other hand, there is greater variability in the cost of fund may be because some other factors besides lending rate affects the cost of fund and causes the banks to vary their rate to a greater degree. This raises the question whether this greater variability can bring about problematic loans through some macroeconomic phenomena. Our interest lies in finding out whether it is possible that the cost of fund affects the lending rate to make loans problematic in the long run. The policy implications are far greater because it requires government to check whether at the time of monetary transmission, the banks arbitrarily increase the cost of funds.
Figure 5.4: Average lending rate of the selected private commercial banks (2006–2017)
🔍 Tap to enlarge
Figure 5.4
Source: Annual reports of respective banks
Bangladesh Bank operates any sort of monetary policy implementation and monitors the interest rate at which all the scheduled banks operate in the country. In many of the BRPD circulars, they have stressed the need to maintain the interest spread and the deposit rate at a tolerant level in order to promote the development of the productive sectors of the economy. This indirectly and intuitively suggests that the controlling of cost of funds by the central bank of Bangladesh can affect the quality of loans which in turn can affect the non-performing loans of the banks. This process can also be viewed from the risk-taking behavior of the banks due to the change in the monetary policy rate.
Variables used for the comparative analysis between state-owned and private commercial banks
Table 5.13: Variables used in the “comparative analysis between the state-owned and private commercial banks”
📊 Data Table↔ Scroll horizontally to view full table
Table 5.13: Variables used in the “comparative analysis between the state-owned and private commercial banks”
Variables
Measure
Definition
Expected sign
PTROAit
PROFIT
Pre-tax profit to total asset
N/A
ATROAit
PROFIT
After tax profit to total
asset
-
EFFit
Efficiency
Operating expense to operating income
-
NPL%it
Credit quality
Non-performing loans to total loans and advances
-
LWOit
Write-off
Total amount of loan write-off
-
LRECit
Recovered loans
Amount of loan which was previously written- off
+
Operating efficiency: This ratio is the measure of how each unit of income is associated with each unit of operating cost. If this ratio increases, it implies that for each taka of operating income, the operating cost of banking is going up. This reflects that banks are struggling for income because of higher cost. Many researchers have used this variable as the measure of identifying the efficiency level of the banks. For example, Abbasoğlu et al. (2007) and Alexiou and Sofoklis (2009) used operating expense to operating income as the measure of expense management and management efficiency and found negative relationship with ROA and ROE. Molyneux and Thornton (1992) used staff expense to total assets and found a positive relationship with profitability. They concluded that increased profit was used for higher payroll and more productive human capital. Athanasoglou et al. (2006) and Curak et al. (2012) found a negative relationship between operating expense to total asset and the profitability of the banks. Therefore, we expect to have a negative relationship between operating efficiency and bank profitability.
Credit quality: Credit risk rises when a borrower becomes incapable or does not pay back their borrowed amount. Normally, it staunches from lending loans but it can also occur from other activities like trading, capital market and counter parties of banks borrowing from other banks (Alexiou and Sofoklis, 2009). Mansur et al. (1993), Sharma and Gounder (2012) used loan loss provision total net loans as a measure of the credit risk. This should provide almost the same measure except for the fact that when loan loss provision is used it generally accounts for management expectation of the loans. This ratio signifies how a bank is preparing for any coming loss by building up loan-loss reserves through annual charges against current income (Alexiou and Sofoklis, 2009). Miller and Noulas (1997) found a negative relationship between credit risk and profitability. Athanasoglou et al. (2008) used loan loss provision to loan as the measure of credit risk and found negative relationship between ROA and ROE. Therefore, we expect a negative relationship between credit risk and bank performance.
Loan write-off: Loan write-off is the amount of bad debts, which the banks omit from the books and balance sheet because of the uncertainty involved in getting back the stipulated amount.
Loan recovered previous written-off: This is the amount of money which has been recovered through management efforts when the loans were written-off due to their inactiveness for a long period of time.
Sample size
This part of the analysis is important for finding out the comparative factors between state-owned and private commercial banks of Bangladesh. For the comparative analysis, 5 state-owned commercial banks out of 6 and 16 conventional private commercial banks out of 33 have been randomly selected.
Descriptive statistics
In this section, the study is devoted to finding the association between bad loans and other loan-related factors to ascertain whether the same general relationship exists for the sample banks compared to the whole banking industry (figures 5.5, 5.6, and 5.7).
🔍 Tap to enlarge
Figure 5.5
Source: Annual reports of respective banks
🔍 Tap to enlarge
Figure 5.6
Source: Annual reports of respective banks
Figure 5.7 depicts the relationship between the cost efficiency of the selected private and public commercial banks for the same year, 2009 to 2017. The result shows almost the same findings that were portrayed in the previous objective. The graph reveals that as the cost per taka income increases for the 16 selected private commercial banks, the profitability declined but the public banks showed positive association between cost efficiency and profitability in many cases.
Figure 5.8 shows the relationship between non-performing loans to total loans, as well as advances and profitability for both banking groups. Here the inverse relationship is clearly found for both banking sectors. There exists a strong negative correlation between bad debts and profitability for the PCBs. On the other hand, the association between NPL and profit for the state-owned banks is not as strong as the private banking sector. This indicates that the profitability of the public banks is severely affected by some other factors other than bad loans. Here both groups almost offer the same banking product, which is interest-based instruments. Therefore, the different sensitivity between profitability and bad loans reveals factors that have no correlation with either banking group.
🔍 Tap to enlarge
Figure 5.7
Source: Annual reports of respective banks
🔍 Tap to enlarge
Figure 5.8
Source: Annual reports of respective banks
Figure 5.9 shows the trend of loan write-off for two groups of banks namely public and private. Although, the loan write-off in the case of both banking groups is increasing by the year, the rate is clearly higher for the public banks compared to the private banks. This indicates that the bad loans of state-owned banks are of very high amounts, which were consistently being written-off from the books. The graph finds both positive and negative relationship between loan write-off and profitability for the state-owned commercial banks just like the findings of overall public banking sector. By contrast, the negative link is visible for the private banks. The graph shows that there are times when the relationship is positive between loan write-off and profitability and there are events when the writing-off of loans enhances the profit. This mixed relationship clearly depicts the difference with the private commercial banks which clearly displays a negative association between these two variables when non-performing loans persist in the balance sheet for a long time private banks do not earn any income from those assets.
Figure 5.10 portrays the average condition of loan recovery and profitability of the selected 16 private and 5 state-owned commercial banks of Bangladesh. During the eight years’ period, the recovery of the written-off loans for both public and private commercial banks increased at almost the same rate. For private banks, the association between the written-off loan recovery and profitability is positive and shows a strong link. However, for the public banks the correlation between the yearly loan recovery and profit is not very visible. This indicates that the recovery of loans by the public banks must be small relative to the respective bank size. Due to the large size of the public banks, the recovered loans did not add enough value to increase the profit of the public bank. On the other hand, the amount of recovered previously written-off loans added value to the private banks for the higher ration of recovery relative to the bank size.
Figures 5.9 and 5.10 show the yearly growth of loan write-off and loan recovery of the selected private and public banks for the year 2010 to 2017. Figure 5.9 shows that for the last four years or so the rate of writing-off loans increased for the state-owned banks compared to the relatively stable rate of the private banks. The right graph shows that the recovery rate previously written-off loans of the public banks is declining for the last couple of years.
🔍 Tap to enlarge
Figure 5.9
Source: Annual reports of respective banks
🔍 Tap to enlarge
Figure 5.10
Source: Annual reports of respective banks
Data analysis
Qualitative analysis for the determinants of non-performing loans
Model specification
In this empirical model, the dependent variable is the perception of the bankers and clients, which shall be regarded as the cause of non-performing loans (NPLs). Furthermore, the dependent variable indicates the severity of the rising non-performing loans in Bangladesh. The independent variables are energy crisis, budgetary expenditure, political instability, number of banks, ease of doing business, merging of the banks, exchange rate, unemployment rate, inflation rate, GDP growth, bank profitability, management efficiency, loan monitoring, IT and MIS, lending rate, cost of fund, banking corruption, loan evaluation, collateral and borrower’s honesty. This study uses the following function for the qualitative analysis for the determinants of non-performing loans.
NPL = f (EC, BE, PI, BANK, EDB, MER, ER, UR, IR, GDP, PRO, ME, LM, IT, LR, COF, BCOR, LE, COL, BOHO)
Validity and reliability of survey data
The internal consistency and reliability of the collected primary data through emails, phone and face-to-face interview has been carried out through SPSS software. The validity test and the reliability statistics is given below. The reliability of the data has been tested by Cronbach's Alpha. Cronbach's Alpha represents the internal consistency of the data collected through questionnaire using the scaling method. One of the most popular internal consistency tests was proposed by Cronbach (1951) which is known as the ‘Cronbach alpha’. This tool measures how well a group of variables evaluates a single idea (Cooper and Schindler, 2006). This tool does not represent any statistical test rather it is a coefficient of reliability or consistency (Bhattarai, 2016). Equation for the Cronback alpha is as follows—
Here α represents the Cronbach’s alpha, N is the number of items, C is the average inter-item covariance, and V is the average variance. Alpha score of 0.7 and above is considered acceptable in the general field of research but very close to 0.7 such as in our case of 0.69 is acceptable in some form of the research study.
Table 5.14: Case processing summary (Total)
📊 Data Table↔ Scroll horizontally to view full table
Table 5.14: Case processing summary (Total)
Case processing summary regarding validity test
Case processing summary regarding validity test
Case processing summary regarding validity test
Case processing summary regarding validity test
Number of observations
%
Cases
Valid
100
100.0
Cases
Excludeda
0
.0
Cases
Total
100
100.0
a. List wise deletion based on all variables in the procedure.
a. List wise deletion based on all variables in the procedure.
a. List wise deletion based on all variables in the procedure.
a. List wise deletion based on all variables in the procedure.
The reliability statistics of the Cronbach’s alpha is sufficient enough to find a relationship between non-performing loans and other factors of non-performing loans.
Table 5.15: Reliability statistics
📊 Data Table↔ Scroll horizontally to view full table
Table 5.15: Reliability statistics
Cronbach’s alpha
Cronbach’s alpha based on
standardized items
Number of items
.701
.686
25
Qualitative analysis for comparative study between stat-owned and private commercial banks
Model specification
Variables for comparing the state-owned and private commercial banks: NPL, PI, BBR, RES, FSA, CI, PR, LWO, LR, CI, WD, B&M, CORR, TECH, MANE, L/C, MON, CS
These variables create the basis for which these different bank groups can be compared because these variables are the more or less common factors of identification which resonates in the banking industry currently. These variables or factors can be used to create a model through which the effect of individual factors can be formulated. In this section of the research, the concern is centered on the perception of bankers and borrowers through which the level of importance of certain factors are put forward. These variables of interest can be used to create a model or at least a basis of a model that can be used to predict any future discrepancies between different bank groups.
Validity and reliability of survey data
Table 5.16: Case processing summary
📊 Data Table↔ Scroll horizontally to view full table
Table 5.16: Case processing summary
Case processing summary
Case processing summary
Case processing summary
Case processing summary
N
%
Cases
Valid
100
100.0
Cases
Excludeda
0
.0
Cases
Total
100
100.0
a. List wise deletion based on all variables in the procedure.
a. List wise deletion based on all variables in the procedure.
a. List wise deletion based on all variables in the procedure.
a. List wise deletion based on all variables in the procedure.
Table 5.17: Reliability statistics
📊 Data Table↔ Scroll horizontally to view full table
Table 5.17: Reliability statistics
Cronbach’s Alpha
Cronbach’s Alpha based on standardized items
Number of items
0.801
-
18
The above table shows the reliability statistics of the survey data for the comparative analysis between the state-owned and private commercial banks. Here our Cronback alpha value is above 0.7 for this questionnaire analysis.
Quantitative analysis for the determinats of non-performing loans
Panel unit root test
Table 5.18: Panel unit root test for the analysis of “determinants of non-performing loans”
📊 Data Table↔ Scroll horizontally to view full table
Table 5.18: Panel unit root test for the analysis of “determinants of non-performing loans”
Variables
Abbreviation
Im-Pesaran Shin
Im-Pesaran Shin
ADF (Fisher type)
ADF (Fisher type)
Level
1st
difference
Level
1st
difference
1
NPL ratio
NPLR
None
Stationary
None
Stationary
2
Real lending rate
RLR
Stationary
Stationary
Stationary
Stationary
3
natural log of Per capita GDP
ln(PCG)
None
Stationary
None
Stationary
4
Loan growth rate
LGR
Stationary
Stationary
Stationary
Stationary
5
Loan growth rate – yearly industry average
LGR_ YIAVG
Stationary
Stationary
Stationary
Stationary
6
Cost of fund
COF
None
Stationary
None
Stationary
7
Real cost of
fund
RCOF
None
Stationary
None
Stationary
8
Average lending rate
ALR
None
Stationary
None
Stationary
9
Real average lending rate
RALR
None
Stationary
None
Stationary
10
Market power
MP
None
Stationary
None
Stationary
11
Size
SIZE
Stationary
Stationary
Stationary
Stationary
Natural log of per capita GDP has been calculated by dividing the log of GDP by the log of population.
Im-Pesaran-shin
Ho: All panels contain unit roots
Ha: Some panels are stationary Fisher Type (ADF)
Ho: All panels contain unit roots
Ha: At least one panel is stationary
The panel unit root test in table 5.17 shows that the variables used in the regression analysis is not stationary at level, but becomes stationary after taking the first difference. Generally, unit root test is used to check whether the data recurs to its original trend. If the data follows a certain trend then it is possible to forecast the change, but if the data abruptly changes its trends from time to time, then the prediction becomes very difficult and even impossible. So if the data is not stationary at level then it is necessary to identify other characteristics of data like first or second difference or some other form of ratio. If the characteristics of data shows a recur ability to its original trend, then it can be safely used to predict the future otherwise spurious results may plague the regression. In this study, the data is seen to be stationary at first difference, so it is appropriate to use the data for analysis to come to a predictable conclusion.
Econmetric model
For capturing the dynamism and the recovery of the consistent estimates of the parameter, dynamism is crucial even when the lagged dependent variable is not of particular interest (Bond, 2002). Instrumental variable (IV) estimators, first proposed by Anderson and Hsiao (1981, 1982) used the difference equation to eliminate the individual fixed effect term μi. The equation is as follows:
yit= αo + γyi,t-1+X`β+ εi,t(1)
εi,t= time fixed effects + individual fixed effects + error
εi,t= λt+ μi + error
εi,t= μi + vi,t[Baltagi. B. H. (2005)]
The yit includes factors that affect all the individuals equally, factors that vary from individuals from time to time, factors which are inherent to the individual, factors which are inherent to time and the error term that can arise from omitted variables, measurement errors etc. We can consistently estimate the equation 1 using the Generalized Methods of Moments (GMM) proposed by Arellano and Bond (1991). The GMM estimation of Arellano and Bond is based on the first difference transformation of equation 1. The transformation of the equation 1 also eliminates the unobserved heterogeneity μi by the first differencing of the equation 1 through subtracting equation 2 from equation 1. The transformed equation is thus the equation 4 below:
One of the assumptions of OLS estimation for correctly estimating an equation is the endogeneity assumption which states that the explanatory variables must not be correlated with the error term. But in this case by nature this assumption is violated because the lagged dependent variable yi, t-1 is correlated with the error component εi,t. This will cause the estimation of the slopes of the explanatory variables to be biased. So the within transformation by subtracting equation 2 from equation 3 is done to wipe out the individual heterogeneity but still the yi, t-1 will be correlated with the remainder error vit. This biasness for the correlation between the explanatory variable and the remainder error term will depend on the scale of T (Baltagi, 2005; Nickell, 1981). Some researchers argue that this bias of the within estimator is not large. For example, Judson and Owen (1999) performed the Monte Carlo experiment for N=20 or 100 and T=5, 10, 20, 30 and found that the bias in the within estimator can be sizeable. The Monte Carlo result also showed that when T=30 the bias can be as 20 percent of the true value of the coefficient of interest.
The first differencing of the equation produces serial correlation between the lagged dependent variable and the error term. In this case, instruments are needed and provided εi,t serially uncorrelated, further lagged values of yit can act as necessary instruments (Islam, 2001). Dynamic panel data method proposed by Arellano and Bond uses instrumental variable and GMM estimation techniques. The first differenced GMM estimator is known to be affected by the cross section units or panels N (Santos and Barrios, 2011). yi,t-2 is expected to be non-correlated with the Δvi,t so yi,t-2 can be used as an instrument in the estimation of the equation 4, given that vi,t are not serially correlated. Thus, the lags of two year or more satisfies the following moment condition E[yit-sΔvi,t] = 0 for T=3,….,T and s is greater than equal to 2 (Louzis et al., 2012).
After taking the first difference of all the variables we can put those variables in the formation of equation (1). Equation (1) takes the baseline model which is our model 1. In model 1, we have NPL ratio as the independent variable and for explanatory variables we have lagged NPL ratio, lagged loan growth rate of 1, 2, 3 and 4, lagged cost of fund up to three years, size and market power.
Quantitative analysis for the comparative study between state-owned and private commercial banks
Panel unit root test:
Table 5.19: Panel unit root test for the analysis of “comparative analysis between the state-owned and private commercial banks”
📊 Data Table↔ Scroll horizontally to view full table
Table 5.19: Panel unit root test for the analysis of “comparative analysis between the state-owned and private commercial banks”
Variables
Abbreviation
Im-Pesaran Shin
Im-Pesaran Shin
ADF (Fisher type)
ADF (Fisher type)
Level
1st
difference
Level
1st
difference
Pre-tax return onasset
PTROAit
Stationary
Stationary
Stationary
Stationary
After tax return on asset
ATROAit
Stationary
Stationary
Stationary
Stationary
Efficiency
EFFit
None
Stationary
None
Stationary
Credit quality
NPL%it
None
Stationary
None
Stationary
Loan write- off
LWOit
None
Stationary
None
Stationary
Loan recovery previously
Written-off
LRECit
None
Stationary
None
Stationary
Econometric model
To better understand the relationship between the profitability and the non-performing loans, efficiency, loan write-off and the determinants of non-performing loans, written-off loan recovery secondary data has been collected from the annual reports of respective banks for the year 2009 to 2017. Dynamic panel data has been applied to formulate the significance level of the relationships. As this method uses the lagged dependent variable it uses dynamic approach that gives findings after adjusting for any effect of past depending variable with the current explanatory variables. Time dummy variables has been employed for controlling the unobserved aggregate macroeconomic effects like price interest rates etc. that can affect all the banks at the same time (Ozkan, A, 2001). The following model has been used in which the different variables are pertinent for understanding the effect of bad loans on profit as well as comparing the public banks’ bad loans with the private banks’:
Table 6.1: GMM estimation result (Arellano Bond – dynamic panel data) one step results
📊 Data Table↔ Scroll horizontally to view full table
Table 6.1: GMM estimation result (Arellano Bond – dynamic panel data) one step results
Dependent variable
Total non-performing loans as percentage of total loans and advances
Dependent variable
Total non-performing loans as percentage of total loans and advances
Dependent variable
Total non-performing loans as percentage of total loans and advances
Dependent variable
Total non-performing loans as percentage of total loans and advances
Dependent variable
Total non-performing loans as percentage of total loans and advances
Dependent variable
Total non-performing loans as percentage of total loans and advances
Dependent variable
Total non-performing loans as percentage of total loans and advances
Dependent variable
Total non-performing loans as percentage of total loans and advances
Explanatory
variables
1
2
3
4
5
6
7
NPL i , t – 1
.465319***
0.000
.433975***
0.000
.455333***
0.000
.421060***
0.000
.44227***
0.000
.474563***
0.000
.446284***
0.000
Macroeconomic
RLR t-3
.193531** 0.025
.213942** 0.018
.152803* 0.064
.211550** 0.032
-.0564131
0.719
.2758823
0.238
-
PCGDP t-1
.806437**
0.027
1.55625***
0.003
.734654*
0.058
1.64580***
0.002
.2716925
0.417
1.02209**
0.015
.861874**
0.030
PCGDP t-2
.950063***
0.004
-1.67021***
0.001
-.898244**
0.011
-1.74542***
0.000
-.343913
0.238
-1.02854***
0.005
-.839523**
0.010
Bank-specific
LGR i , t – 1
.003169
0.807
-.01283
0.384
.0018237
0.888
-.001257
0.930
-.003933
0.781
LGR i , t – 2
.009564
0.375
.017386
0.159
.0107634
0.320
.018636
0.147
.013086
0.271
LGR i , t – 3
.01989**
0.027
.021864**
0.034
.0193631**
0.031
.015158
0.174
.021655**
0.026
LGR i , t – 4
.027876***
0.001
.021667**
0.014
.029162***
0.001
.023802***
0.008
.024319***
0.006
LGR i , t – 1–
YIALGRt-1
.0001285
0.992
-.0123311
0.398
LGR i , t – 2–
YIALGRt-2
.0058631
0.586
.0186319
0.147
LGR i , t – 3–
YIALGRt-3
.0182928**
0.042
.0217004**
0.041
LGR i , t – 4–
YIALGRt-4
.023134***
0.008
.0182873**
0.036
Cost of fund
i , t – 1
-0.144819
0.177
-.0516771
0.625
Cost of fund
i , t – 2
-.016853
0.897
-.0442968
0.738
Cost of fund
i , t – 3
.273433**
0.035
.3092068**
0.016
RCOF i , t – 1
-.221486**
0.027
RCOF i , t – 2
-.029661
0.823
RCOF i , t – 3
.2713827**
0.049
LR i , t – 1
-.297345**
0.019
-.234799*
0.051
LR i , t – 2
.363528*
0.052
.420835**
0.030
LR i , t – 3
.2163687
0.137
.238725
0.108
ARLRB i , t – 1
-.074298
0.389
-.09958
0.231
ARLRB i , t – 2
.285559*
0.064
.1589165
0.146
ARLRB i , t – 3
.040306
0.819
.2216223**
0.012
Sizeit
.068747***
0.002
.0564332**
0.012
.072338***
0.002
.0555719**
0.014
.060232***
0.007
.030957
0.206
.031839
0.192
Market Powerit
-.614380***
0.000
-.537859***
0.000
-
.631732***
0.000
-.546802***
0.000
-.53743***
0.000
-.364976**
0.019
-
.374906**
0.016
constant
.37828
0.430
.264155
0.603
.461341
0.331
.195018
0.693
.0904132
0.842
-.100424
0.842
-.233562
0.632
Number of obs
112
112
112
112
112
112
112
Number of
groups
16
16
16
16
16
16
16
Obs per group
7
7
7
7
7
7
7
Sargan test
0.1381
0.1154
0.1195
0.1124
0.1139
0.1221
0.0935
1st ord
autocorrelation
0.0026
0.0034
0.0021
0.0036
0.0030
0.0026
0.0034
2nd ord
autocorrelation
0.7343
0.8862
0.8048
0.8190
0.7008
0.7474
0.7543
Number of
instruments
62
62
62
62
62
62
62
Arellano bond test for zero autocorrelation in first-differenced errors H0: No autocorrelation, Sargan test of over identifying restrictions, H0: over identifying restrictions are valid
Source: Author's own calculation from collected data
For each model, the previous year’s NPL is significantly related with the current year’s NPL in a positive manner. In this research, the ratio of non-performing loans to total loans and advances have been used which is the ratio of the respective cumulative amounts. This relationship indicates that if NPL is relative to total loan rises today, there is a significant probability that the ratio of NPL to total loans will rise the next year. This may be due to the fact that the previous loans with two or three year’s maturity period and some of the current year’s loans are being constantly defaulted. Another possibility is that banks have a limit of loan disbursement which may be related to size and efficiency; or the supply of good borrowers is not enough. Therefore, constantly increasing the amount of loans may not be feasible for banks. So the NPL is relative to total loans may rise out of the bank’s inability to procure a larger number of good clients (which could have decreased the NPL ratio). Another possibility is that the cycle of good condition of loans or the cycle of bad condition of loans is higher than the previous two or three years which makes it harder to turn the loan condition better. Once the NPL declines, the declining rate continues may be because the banks give out more long-term loans which take some years to become default that lowers the ratio for a couple of years.
In Model 1 to 4, the three year lagged real lending rate (RLR) of the economy poses a significant positive relationship with long-term NPL. But in Model 5-7, the RLR does not have a significant link with NPL in general. This indicates that in general when the interest rate rises, the credit quality deteriorates in the long run. This is consistent with our findings regarding the relationship between the bank-specific average lending rate and NPL. As lower inflation rate is positively correlated with lower GDP growth, it increases the chance of loan default (Shu, 2002). Higher RLR in times of low inflation can cause lower economic growth in the subsequent years which can trigger an increase in the bad loans in the following years gradually.
Regression analysis shows that a rise in per capita GDP (PCGDP) does not immediately get absorbed in the economy—it takes time to affect the quality of loans. A growth in one year lagged PCGDP shows a positive relationship with NPL which indicates that in booming economic time, banks lend excessively without much concern about the borrowers’ credit quality. Banks most likely expect that the booming growth of the economy may increase the likelihood of the borrowers’ ability to make profit and pay back the interest on time. Banks with long-term loans may experience an increase in the borrowers’ inability to pay interests to the banks which may increase NPL, but the effect of economic growth is slowly absorbed in the business. Thus, the effect of growth of PCGDP takes time to make investments fruitful. The effect of PCGDP is the same across all models, thus suggesting this macroeconomic variable has significant long-term implications for the fluctuation of NPL.
Loan growth rate (LGR) has positive significant relationship with long-term credit loss or NPLs. Normally, if the bank accumulates new loans with different maturity, both the possibility of short-term credit loss and long-term credit loss rises. Economic growth in this regard comes into play in determining the impact over loan quality. The long-term positive significance between excessive loan growth and the deterioration of credit quality can be explained by the borrowers’ long-term inability to pay regular interest. Banks may lend excessively when the economy booms, but after a couple of years when the economy begins to deteriorate, the borrowers turn out to be defaulters. The lesson learnt here is that the bank’s random risk-taking behavior, by increasing the loan-deposit ratio to make extra profits in the boom period, does not pay off. In Bangladesh, the effect of GDP growth takes time to affect private commercial banks. As mentioned earlier, the effect of lagged GDP has different impact on the banks’ overall condition. However, banks sometimes become reckless in loan disbursement not accounting for borrowers with bad credit assessment. Such over-expectation of banks can lead to non-performing loans, considering the way GDP operates in Bangladesh. In Model 1, it is evident that the significance of excessive loan growth gradually increases with time, that is, if banks provide excessive loan today there is a greater chance for the loans to become bad after three-four years rather than one–two years. In Model 2, higher loan disbursement over the market average loan growth can also cause non-performing loans in the future.
An empirical analysis also found non-performing loans to total loans to be negatively associated with the bank size. Bigger banks have higher non-performing loan amount relative to the smaller banks, but the concern arises as the relative size of NPL to total loans is getting bigger. Smaller banks seem to be more efficient in handling non-performing loans than larger banks. In this regard, economies of scale come into play according to some research. Larger banks may have reached a certain point in size from where it is difficult to monitor and evaluate loans. Smaller banks are yet to reach the economies of scale which makes them better at handling their smaller resources, besides being more cautious in giving out loans.
Market power (MP) has been found to affect the rise of non-performing loans in different economic situations, and negatively so during periods of inflation. During economic growth and higher investment returns, higher lending seems to lower the NPL ratio. This is because banks may lend excessively for long-term projects during the growth period, but it is only when the economy starts slow down after a period that the bad loans show up, which explains the lagged significance of per capita GDP in this study.
Research question 2 findings
Long-term impact of cost of fund
Cost of fund has a significant impact on non-performing loans in the long run (Table 6.2: Model 3) rather than the short-term. For the higher cost of fund, banks charge higher lending rates to borrowers. This is because after loan disbursement to any borrower, banks make investments in their projects for higher profitability. Because of higher lending rates of interest, borrowers face cash-flow problems and less profitability. This gradually creates pressure on borrowers and loans get converted to bad loans. In the same manner, non-performing loans also have similar impact on the cost of fund. Due to higher NPLs, banks book more deposit with the higher rate for covering the NPL amount. In this situation, a significant deposit amount get blocked as NPLs. In the short-term, banks and borrowers, do not often realize the impact of the cost of fund and non-performing loans. The results of this study show a positive relationship between the banks’ cost of fund and non-performing loans in the long run. The explanation below provides a two-way causation of the cost of funds and non-performing loans.
Cost of funds affecting non-performing loans
Findings suggest that the rise of the cost of funds affect non-performing loans through cyclical channels of lending rate, demand of deposits, quality of loans, etc. Cost of fund can increase when there is liquidity crisis in the economy or when the rate of national savings certificate inclines, that is when fund becomes scarce. This is when banks raise the cost of fund in order to attract more depositors so that the banks can provide loans and stay in the competition. However, in the process, this causes the banks to lose profit if they do not increase the lending rate. Banks usually want to increase spread and retain their profitability at a maximum level, so they increase the lending rate for the higher cost of fund. In the process, the borrowers take the impact of higher lending rates which affects their cash flow; so they regularly default and in time their loans turn into NPLs. In this scenario, if any individual bank increases their lending rate they can lose customers but if the whole banking sector increase the lending rate then the whole pressure is borne by the borrowers. In the case of individual banks who hike up the lending rate, they lose good customers at the expense of lower category but high-risk borrowers. Such borrowers are always in need of funds but they generally have a bad reputation, and banks generally end up incurring non-performing loans by providing these borrowers, loans for yielding higher spread.
In this situation of higher cost of funds, more depositors deposit their money and so the supply of deposits increase. This happens mostly in the short run, since the higher rates quickly attract depositors, as in Bangladesh the choice of investments are limited. In this high liquidity scenario, more funds are available for providing loans, but with higher lending rates. Borrowers usually take loans reluctantly and bear the burden of higher cost of funds. Many borrowers find it hard to pay back the borrowed money, and as mentioned earlier the gradual overdue turns into non-performing loans in the long run. Now from the banks’ point of view: they constantly adjust their lending rates to increase their spread by ensuring credit growth with higher lending rates. Banks receive long-term deposits which have to be adjusted with similar term loans. If banks constantly receive long-term funding, they run the possibility of incurring NPLs. Such banking processes underlies the occurrence of non-performing loans in the long run.
Non-performing loans causing the cost of fund to rise
Truly, cost of fund leads to higher non-performing loans but the opposite is also true when non-performing loans pile up. Non-performing loans are money given by depositors or investors to the bank for increasing its value. If NPLs accumulate steadily and the depositors want their money back, the banks may not be able to return their deposits with interest. Consequently, the banks run the possibility of going bankrupt. To prevent such a hazard, banks are constantly on the lookout for more deposits to fill up existing and new NPLs. This is not easy due to market competition as there are plenty of other banks also looking out for funds. Interestingly in this situation when banks are struggling to maintain growth of general loans and performing loans, they must offer higher lending rates. Yet, banks find it difficult to disburse new loans as they run the risk of incurring fresh bad loans on top of the accumulated bad loans. As a result, being unable to lend more money, the banks become less able to meet the demand of the depositors which results in a liquidity crisis. The banks keep higher provisions for the depositors and consequently their profits are affected. In this situation, the recovery of bad loans becomes imminent and as indicated earlier, the lending rate remains higher than usual.
One of the findings show that a higher lending rate leads to a decline in loan demand, which makes the current non-performing loans smaller. This situation however does not last long as banks ultimately increase loan growth abruptly and lend to borrowers with lower level credit worthiness to maintain their earnings. This again leads to an increase in bad loans in the long run.
Research question 3 findings
The research question tried to investigate the impact of cost of fund and lending rate through face-to-face interview, phone and emails. It was agreed by 52 percent bankers that increasing cost of fund could result in the rise of non-performing loans. However, the rest of the bankers remained neutral. Most borrowers on the other hand, agreed that in many situations cost of fund induced a change in lending rate.
Figure 6.1: Bankers' perception on cost of fund and lending rate affecting NPLs
🔍 Tap to enlarge
Figure 6.1
Source: Field survey data 2018
Figure 6.2: Borrowers' perception on cost of fund and lending rate affecting NPLs
🔍 Tap to enlarge
Figure 6.2
Source: Field survey data 2018
The survey reveals that bankers have given greater weight to lending rate figures (6.1 and 6.2) compared to cost of fund, although 52 percent of bankers agreed or strongly agreed that cost of fund did affect non-performing loans at some point in time. It was agreed by 60 percent of bankers that increasing lending rate actually causes the bad loans to incline. One-fourth of the bankers remained neutral on the effect of lending rate and cost of fund on bad loans. On the other hand, borrowers were more concerned with lending rate (figure 6.3) than bankers. It was agreed or strongly agreed by 76 percent of borrowers that higher lending rate increase non-performing loans.
Figure 6.3: Overall perception of the effect of cost of fund and lending rate affecting NPLs
🔍 Tap to enlarge
Figure 6.3
Source: Field survey data 2018
The overall scenario also indicates the severity and importance of these two variables (cost of fund and non-performing loans) on the condition of loan quality. In both cases, over 50 percent of the bankers and borrowers expressed their concerns about the impact of cost of fund and the lending rate on non-performing loans.
The overall scenario points towards some of the important and most agreed determinants of non-performing loans from an overall perspective. Banking corruption, fund diversion and low monitoring of loans seem to be the important determinants of non- performing loans overall. This is not surprising considering the scam and corruption of the state-owned banks and some other financial institutions which have almost crippled the whole banking process in the last five to six years. Furthermore, a combination of factors, such as management inefficiency and unhealthy competition among the banks, also largely contribute a lot to the rise in the bad loans. Some of the previous studies (Rifat, 2017; Rahman et al., 2016; Mondal, 2016) showed that macroeconomic factors were the least of factors affecting bad loans, which is in alignment with this study. Data from the survey (figure 6.4) shows that the respondents viewed macroeconomic factors such as GDP growth, inflation, exchange rate, energy crisis and unemployment rate to be unimportant in the context of Bangladesh. As banking scams and management inefficiency have increased, the effect of economic growth and business scope has become almost insignificant. Another interesting finding of this survey is the ease at which business is conducted has contributed to rising non-performing loans. The following figures display the significant factors that have found favor with the respondents.
Figure 6.4: Least to highest causing factor of NPLs
🔍 Tap to enlarge
Figure 6.4
Source: Field survey data 2018
🔍 Tap to enlarge
Figure 6.5
🔍 Tap to enlarge
Figure 6.6
Source: Field survey data 2018
🔍 Tap to enlarge
Figure 6.7
🔍 Tap to enlarge
Figure 6.8
Source: Field survey data 2018
Of the overall respondents, 86 percent have suggested that higher political instability hampers business processes and ultimately affects the loan repayment capability of borrowers (figure 6.5). Over 90 percent of respondents have identified management problems to be a significant factor in explaining the bad loans that prevail in the banking sector of Bangladesh (figure 6.6). This result supports the importance of banking corruption and bad loan evaluation explained through figure 6.9.
🔍 Tap to enlarge
Figure 6.9
🔍 Tap to enlarge
Figure 6.10
Source: Field survey data 2018
Over 90 percent of respondents have agreed that management inefficiency (like loan monitoring, unhealthy competition, fund diversion and corruption) have affected the rise of bad loans more than other systematic factors like economic growth. Thus, it can be concluded that in the presence of factors like banking inefficiency and corruption, the role of positive indicators of economic prosperity does not reflect the condition of loan quality as the previous section of this thesis suggested.
Research question 4 findings
Regression analysis: GMM estimation
Table 6.2: GMM regression analysis for the “comparative analysis between the state-owned and private commercial banks”
📊 Data Table↔ Scroll horizontally to view full table
Table 6.2: GMM regression analysis for the “comparative analysis between the state-owned and private commercial banks”
GMM estimation
Private commercial Banks
Private commercial Banks
Private commercial Banks
Private commercial Banks
State-owned commercial
Banks
State-owned commercial
Banks
State-owned commercial
Banks
State-owned commercial
Banks
Dependent variable
After tax ROA
After tax ROA
Pre-tax ROA
Pre-tax ROA
After tax ROA
After tax ROA
Pre-tax ROA
Pre-tax ROA
Independent
variables
Return on Asset
(ROA)t-1
.26176***
0.002
.26176***
0.002
.21324***
0.007
.21324***
0.007
-.01501
0.935
-.01501
0.935
-.007550
0.965
-.007550
0.965
Inefficiency,
INEFFit
-.02422***
0.002
-.02422***
0.002
-.049893***
0.000
-.049893***
0.000
.001295
0.219
.001295
0.219
.001357
0.201
.001357
0.201
Credit quality,
NPL%it
-.089938***
0.006
-.089938***
0.006
-.144389***
0.002
-.144389***
0.002
-.08876**
0.010
-.08876**
0.010
-.09700***
0.004
-.09700***
0.004
Loan write-off (cumulative),
LWOit
-.000353* 0.086
-.000353* 0.086
-.000803*** 0.009
-.000803*** 0.009
.000295
0.249
.000295
0.249
.000431
0.100
.000431
0.100
Loan recovery
(yearly), LRit
.004511**
0.023
.004511**
0.023
.00970***
0.000
.00970***
0.000
.001807
0.722
.001807
0.722
.003886
0.481
.003886
0.481
Time dummy
Yes
Yes
Yes
Yes
Yes
Yes
Yes
Yes
Constant
.02881***
0.000
.02881***
0.000
.053313***
0.000
.053313***
0.000
.0039605
0.806
.0039605
0.806
.000123
0.994
.000123
0.994
Sargan test, Prob
> chi2
0.2743
0.2743
0.4059
0.4059
0.4494
0.4494
0.4746
0.4746
1storder auto corr
0.0045
0.0045
0.0040
0.0040
0.0959#
0.0959#
0.0712
0.0712
2ndorder auto corr
0.9074
0.9074
0.6617
0.6617
0.1827#
0.1827#
0.2158
0.2158
Instruments
40
40
40
40
34
34
34
34
Observations
112
112
112
112
35
35
35
35
GMM estimation
Observation per
group
7
7
7
7
7
7
7
Number of groups
16
16
16
5
5
5
5
Independent
variables
Return on Asset
(ROA)t-1
.262122***
0.003
0.20710**
0.011
0.20710**
0.011
-.016010
0.943
-.016010
0.943
.01377
0.950
.01377
0.950
Inefficiency,
INEFFit
-.02684***
0.000
-.05444***
0.000
-.05444***
0.000
.001225
0.275
.001225
0.275
.001248
0.278
.001248
0.278
Credit quality,
NPL%it
-.09691***
0.003
-.1477***
0.001
-.1477***
0.001
-.10673***
0.002
-.10673***
0.002
-.11821***
0.001
-.11821***
0.001
Loan write-off
(Yearly), LWOit
-7.01e-13
0.133
-1.55e-12**
0.018
-1.55e-12**
0.018
-8.06e-14
0.893
-8.06e-14
0.893
-1.67e-14
0.979
-1.67e-14
0.979
Loan recovery
(yearly), LRit
.004673**
0.018
.00952***
0.000
.00952***
0.000
.002733
0.611
.002733
0.611
.005009
0.362
.005009
0.362
Time dummy
Yes
Yes
Yes
Yes
Yes
Yes
Yes
Constant
.02459***
0.000
.04637***
0.000
.04637***
0.000
.028228***
0.005
.028228***
0.005
.03081
0.003
.03081
0.003
Sargan test, Prob
> chi2
0.3377
0.5261
0.5261
0.5336
0.5336
0.5425
0.5425
1storder auto corr
0.0061
0.0066
0.0066
-
-
-
-
2ndorder auto corr
0.9531
0.6672
0.6672
-
-
-
-
Instruments
40
40
40
34
34
34
34
Observations
112
112
112
35
35
35
35
Observation per
group
7
7
7
7
7
7
7
Number of groups
16
16
16
5
5
5
5
# No time dummies
The above findings suggest that the outcomes are different for state-owned and private commercial banks. In terms of inefficiency, the results suggest that private commercial banks are sensitive to relative increase in operating cost, compared to state-owned commercial banks. In case of private commercial banks, for each unit increase in inefficiency, the pre-tax and after tax profit decreases with time. But for state-owned commercial banks, the result indicates that increase in cost inefficiency does not significantly affect the after tax and pre-tax profit of the banks. With factors other than cost being much more dominant in state-owned commercial banks, cost inefficiency does not sufficiently explain the change in profit.
On the other hand, non-performing loans play an extremely significant role in profitability change in both private and public banks. In Bangladesh, the effect of bad debts is so pervasive that any change in the ratio of bad loans to total loans & advances, leads to a change in the banks’ income. The findings suggest that both pre-tax and after tax profit is affected by bad debts in both these banking groups.
Loan write-off affects different bank groups differently, which has been vindicated by the secondary analysis. The profit of private commercial banks is significantly affected by loan write-off in a negative manner. The negative relationship between loan write-off and profit in private banks indicate that non-performing assets had increased in the book of the bank and therefore banks wanted to remove those non-performing assets to increase the return on asset. When bad loans increase, the return on asset takes a hit because the loans stay on the asset side of the balance sheet without contributing to profit. To resolve this, banks write-off loans which reduces the NPL amount although the profit had already fallen on high non-performing assets. Therefore, when banks show large write-offs, it indicates that the profit was declining for high-end bad loans, due to which lower profit and increased write-offs occurred at the same year ending.
The negative equation between loan write-off and profitability of public banks indicate that the amount of loans being written-off is balanced with the same amount of capital injection. Due to this capital injection, the write-offs do not lead to change in profits.
The pre-tax profitability is relatively significant for both bank groups. The after tax profitability is less significant for these banks. Public banks are being taxed in such a way that loan write-off does not affect profitability at all or rather insignificantly. In case of private commercial banks, when loans are written-off, profit is affected negatively. So the higher their loan write-off, the lower their pre-tax and after tax profit. Clearly, public banks are less affected by loan write-off. The loan write-off rate of SCBs in the last few years has been growing at a heavy pace compared to private commercial banks.
Another interesting finding shows that loan recovery does not significantly increase the profit of state-owned banks. From figure 5.8 is clear that the recovery rate in state-owned commercial banks is not as noteworthy as in private commercial banks. However, the size of the bank plays an important part in this matter. As the size of state-owned banks is relatively larger than that of many selected private commercial banks, it is possible that the recovery amount may be larger in state-owned banks but not large enough to improve profit. The small size of private banks helps them to manage their write-off loans much more easily.
Comparative distinction between SCB and PCB in Bangladesh
The findings of the comparative analysis are based on a field survey questionnaire answered by 100 bankers and borrowers. Their perceptions have been recorded as given below: from the severity of non-performing loans was given the greatest weight in this survey. The subsequent factors, namely, profit, capital injection, use of technology, corruption, willful defaulters, cost inefficiency, branding, promotion, loan default against L/C acceptance (inland) and customer service came next in importance for the respondents as basis for this comparison of public banks with the private.
Figure 6.11: Least to highest comparing factors for non-performing loans in state-owned and private commercial banks
🔍 Tap to enlarge
Figure 6.11
Source: Field survey data 2018.
After each respondent have expressed their opinions their LIKERT scores was summed and all the agreement levels were averaged in order to gain the major comparing factors.
Table 6.3: Important factors that identifies the SCBs from PCBs
📊 Data Table↔ Scroll horizontally to view full table
Table 6.3: Important factors that identifies the SCBs from PCBs
1
Non-performing loans
2
Effect of NPL on profit
3
Capital Injection
4
Use of technology
5
Corruption
6
Willful defaulters
7
Cost inefficiency
8
Marketing and branding
9
Loans default against L/C acceptance (inland)
10
Customer service
The maximum score is 500 out of which the closest variables or factors were taken into consideration as comparison criteria. From the above horizontal bar graph, it is evident that ten factors scored above or near 400 and close to the strongly agreed condition.
Agreement level in percentage (%) of the respondents for different comparative criteria
🔍 Tap to enlarge
Figure 6.12
🔍 Tap to enlarge
Figure 6.13
Source: Field survey data 2018
Figure 6.12 shows that around 80 percent of respondents agreed or strongly agreed about the severity of non-performing loans in public banks compared to private banks. Most respondents showed a similar pattern of response due to the bad credit culture and fund diversion incidents in public banks over the last six-seven years. Figure 6.13 shows that generally capital injection is much higher in public banks.
Figure 6.14 portrays the respondents’ view on the use of advanced banking technology in public banks compared to private banks in Bangladesh. Of the total respondents, 58 percent strongly suggested that public banks are way behind private banks in use of technological benefits for customers and raise transaction security. Interestingly, with regard to corruption, only 45 percent strongly agreed and 38 percent agreed that public banks are more corrupt than private banks illegal. 38 percent agreed that management issues leading to corruption or corruption incidents independently deteriorated the profit of public banks (figure 6.15).
🔍 Tap to enlarge
Figure 6.14
🔍 Tap to enlarge
Figure 6.15
Source: Field survey data 2018
In terms of branding and promotion of banking products, most respondents agreed that public banks are less interested or less experienced in promoting their products and services in a competitive manner as compared to private banks. Figure 6.17 shows the participants’ view on the position that willful defaulters mostly go to public banks for acquiring loans. This is possibly due to the mindset of borrowers that they could get away with not repaying the loan amount in time due to the weak monitoring and credit policy of public banks.
🔍 Tap to enlarge
Figure 6.16
🔍 Tap to enlarge
Figure 6.17
Source: Field survey data 2018
🔍 Tap to enlarge
Figure 6.18
🔍 Tap to enlarge
Figure 6.19
Source: Field survey data 2018
Majority of the respondents agreed or strongly agreed that cost inefficiency was a significant factor influencing the profit of public banks compared to private banks. Surprisingly, this perception is in direct contradiction with the findings of secondary analysis, which showed that cost inefficiency was not a significant factor in the income of public banks (figure 6.18). Figure 6.19 shows strong agreements among respondents on loan against L/C acceptance (inland) being a significant factor in explaining bad debts in public banks compared to private banks.
🔍 Tap to enlarge
Figure 6.20
🔍 Tap to enlarge
Figure 6.21
Source: Field survey data 2018
Figures 6.20 and 6.21 depict the respondents’ views on customer service and political influence. Of the respondents, 43 percent strongly agreed that customer service is extremely poor in public banks relative to the private banks in Bangladesh. 31 percent of the participants agreed that it is indeed the case that customer service is poor in public banks compared to private banks. It could be that some respondents chose to just agree (not strongly agree) in this question because they have received better quality services in certain public banks or of equal merit to that of private banks.
48 percent of respondents strongly agreed that political influence has indeed plagued public banking industry much more than in private banks. 32 percent of respondents remained neutral which may indicate that in the viewers’ perception, both banking groups are affected equally by political influence, or they perhaps just do not want to respond.
Regarding the first research question of this study, the analysis reveals the determinants of non-performing loans and elaborates the long-term effect of excessive credit lending and cost of fund on the credit quality of the private commercial banks of Bangladesh.
The study suggests that previous loans with two to three years’ maturity period and some current year loans are being constantly defaulted. It also shows that banks have a limit of loan disbursement that may be related to size and efficiency of the respective banks. The scarcity of good borrowers for utilization also came up in the analysis. But increasing the amount of loans may not be feasible as the NPL relative to total loans may rise out of the banks’ inability to procure a larger number of good clients (which may decrease the NPL ratio).
Generally, cycles of bad or good condition of loans continue for two to three years. If NPL declines, the banks give out more long-term loans which take some years to become default keeping the ratio low for a couple of years.
Generally, when interest rate rises, credit quality deteriorates in the long run. This is consistent with our findings on the relationship between the bank-specific average lending rate and NPL. As lower inflation rate is positively correlated with lower GDP growth which increases the chance of loan default (Shu, 2002), higher RLR in times of low inflation can cause lower economic growth in the subsequent years which can trigger an increase in the bad loans in the following years gradually.
This study found that a rise in per capita GDP (PCGDP) today does not immediately get absorbed in the economy rather it takes a long time to see any visible effect on the condition of loans. In booming economic time, banks lend excessively without much concern about the borrowers’ credit quality. Banks most likely expect that the booming growth of the economy may increase the likelihood of borrower’s ability to make profit and provide the banks with interest in time. Banks with long-term loans may experience an increase in borrower’s inability to give interests to the banks which may increase NPL but the effect of economic growth is slowly absorbed in the business. Thus, the effect of growth of PCGDP takes time to make investments fruitful.
Loan growth rate (LGR) has positive significant relationship with long-term credit loss or NPLs. Normally, if the bank accumulates new loans with different maturity, both the possibility of short-term credit loss and long-term credit loss rises. Economic growth in this regard comes into play in determining the impact over loan quality. The long-term positive significance between excessive loan growth and the deterioration of credit quality can be explained by the borrowers’ long-term inability to pay regular interest. Economy may turn out to be booming when banks lend excessively but after couple of years when the economy deteriorates the borrowers are forced to become defaulted. The implication here is the bank’s abrupt risk taking by increasing the loan-deposit ratio to make extra earnings in booming period.
In Bangladesh, the effect of GDP growth takes time to impact private commercial banks (as hinted earlier). Banks sometimes become reckless in loan disbursement not accounting for the borrower’s credit quality. This over expectation of banks can lead to non-performing loans considering the way GDP operates in Bangladesh. In the Model 1, it is evident that the significance of excessive loan growth gradually increases with time that is if banks provide excessive loan today there is a greater chance for the loans to become bad after four years or three years rather than one or two years. In the Model 2, higher loan disbursement over the market average loan growth can also cause non-performing loans in the future.
Bigger banks have higher non-performing loan amount relative to the smaller banks which may be normal (considering the size of the banks), but the concern arises when the relative size of NPL to total loans is getting bigger. Smaller banks seem to be more efficient in handling non-performing loans than larger banks. In this regard, economies of scale come into play. Larger banks may have reached a certain point from where higher loans make it difficult for banks to monitor and evaluate loans. Smaller banks are better at handling smaller resources but larger banks may find it difficult to handle higher amount of loan growth. This can increase the non-performing loans of such banks. On the other hand, smaller banks are yet to reach the economies of scale for which they effectively manage their resources and are more cautious in giving out loans.
Market power (MP) has been found negatively affecting the rise of non-performing loans in all the economic condition but shows a little more significance in inflationary periods. During economic growth and higher investment returns, higher lending seems to lower the NPL ratio. This is because banks may not incur bad loans when they lend excessively for long-term projects until the economy slows down a bit, which explains the lagged significance of per capita GDP in this study.
Research question 2 conclusion
This study portrays the bi-directional relationship between the cost of fund and non-performing loans. Firstly, considering the effect of cost of fund on non-performing loans the subsequent findings formulates the conclusion.
The research suggests that the relationship between the cost of fund and non-performing loans is constituted through a cyclical channel of lending rate, demand of deposits, quality of loans, etc. Cost of fund can increase when there is liquidity crisis in the economy or when the rate of national savings certificate rate inclines that is when fund become scarce. However, in the process this causes the banks to lose profit if they do not increase the lending rate. In the process, the borrowers take this hit of higher lending rate which affects their cash flow so they regularly keep overdue and these loans gradually becomes non-performing loans in the long run. Another scenario occurs when banks are getting long-term deposits. When banks receive long-term deposits, adjustments must be made with similar types of maturity of loans. If banks use short-term deposits for the long-term loans then the banks run the situation of liquidity crisis. This whole process of the bank itself and the borrowers exhibit the condition of non-performing loans in the long run.
Secondly, the effect of higher non-performing loans on the cost of fund comes into play. When there is higher growth of non-performing loans, banks will generally have to offer higher cost of fund to attract more depositors with a hope to fill up the higher risk loan positions. Interestingly, in this situation when the bank is struggling to maintain growth of performing loans and general loan growth they must offer higher lending rate. In this situation, banks find it difficult to disburse new loans because of running the risk of new bad loans with already piled up bad loans in the book. As a result, being unable to lend more money, the banks become less able to meet the demand of the depositors which causes liquidity crisis. The banks keep higher provisions for the depositors and their profits become affected as a result.
Research question 3 conclusion
This part of the study investigates the determinants of non-performing loans through questionnaire survey to the bankers and borrowers. Over 50 percent of the bankers and borrowers expressed their concerns about the impact of cost of fund and the lending rate on non-performing loans. Banking corruption, fund diversion and less monitoring of loans seem to be the most important determinants of non-performing loans from the overall point-of-view. This is not surprising because of the scam and corruption of the state-owned banks and some other financial institutions which have almost crippled the whole banking process in the last few years. Furthermore, a combination of factors such as management inefficiency and unhealthy competition among the banks also largely contribute a lot to the rise in the bad loans. Data from the survey shows that the respondents also viewed the macroeconomic factors such as GDP growth, inflation, exchange rate, energy crisis and unemployment rate to be the least important factor in the context of Bangladesh.
Research question 4 conclusion
This study has conducted a comparative analysis between the state-owned and private commercial banks based on questionnaire survey and secondary data analysis.
Regression panel data analysis found the private commercial banks to be more sensitive to the change in the operating efficiency compared to the state-owned banks. There is no significant effect of the change in operating efficiency on the change in the profitability of the state-owned banks. Non-performing loan is extremely significant in explaining the profitability change of both private and public banks. Loan write-off affects the different bank groups (state-owned and private) differently which has also been vindicated by the secondary analysis. The profit of private commercial banks is significantly affected by loan write-off in a negative manner. On the other hand, loan write-off has insignificant effect on the profitability of the state-owned commercial banks. The study also found that loan recovery is not significantly increasing the profit of the state-owned banks.
The comparative analysis revealed the important indicators for which the state-owned banks are lagging behind the private banks. The severity of the non-performing loans has been mostly depicted in the public banks to private banks. Profit, capital injection, use of technology, corruption, willful defaulters, cost inefficiency, branding, promotion, loan default against L/C acceptance (inland) and customer service were the main factors that the respondents felt to be the important basis for the comparison of pubic banks with the private.
Creating balance between loan growth and asset-liability: Banks should maintain the loan growth based on the deposit-mix and asset-liability management. Furthermore, increasing the loan growth without considering the loan recovery can have long run implications on the performance of the loans. Therefore, banks should formulate procedures regarding the growth of loans based upon the proper forecasting of liability conditions with the probability of future loan recovery.
Analyzing the future economic growth: In good economic times, banks have a tendency to make error about the borrowers’ success rate, which has ramifications regarding the quality of loans in the future. Even when the situation of higher risk may seem profitable banks must understand the market trend and give prudential analysis to measure the susceptibility of deterioration of loans.
Maintaining appropriate proportion between the bank sizes and lending: Banks must analyze their capacity to cope with sudden economic shocks and downturn. Due to different sizes of banks, the efficiency level of different banks differs. So banks must not offer loans without analyzing the impact it could have on the risk exposure of the banks particularly due to the size.
Reducing loan growth in times of inflation: Banks should pay more attention to their loan growth or investment growth in times of inflation. Banking policy should be reassessed when inflation rate changes because of its impact it could have on the interest rate.
Enhancing the capital market: Capital market should be strengthened for making financing options more flexible and easier. If the capital market is made strong and competitive then this will take off the pressure from the banks for long-term financing. Capital market can be made flexible for raising long-term funds for which investors should be encouraged. Capital market has the potential for long-term financing for infrastructure development of the economy. Investors should be encouraged to raise funds from the capital market for long-term investment. So capital market of our country should be made strong with proper rules and regulation. Government and BSEC should motivate companies to come to capital market and do business with equity instead of funds borrowed from banks. As a result, the pressure from the banks will be reduced and borrower’s profitability will increase due to equity investment.
Reducing loan growth with single borrower exposure: Banks should not target single large corporate customers to provide loan facility when the need of extra credit limit is not necessary in reality. This can create the opportunity for borrowers to divert funds that causes these loans gradually to become non-performing. When non-performing loans to total loans are rising, banks should reduce single borrower exposure to reduce the risk of loans being defaulted. Banks should maintain diversified portfolios to reduce the risk exposure of their investments.
Reducing loan growth in proper circumstances: When the recovery of loans becomes slow, banks should be careful in giving out excessive loans. In this situation, liquidity crisis can take over because if the existing loans are not being recovered then adding extra loans will increase the risk of different categories of loans of being in a default position.
Cautious in bad loan takeover: Due to unhealthy competition, banks should not take over bad loans from other banks with enhanced limit. It will give negative signal to the borrowers and they may start to misuse this option for higher opportunities. Banks should be careful in taking over clients with higher loan limit. In case of taking bad clients from different banks with higher credit limit, risk regarding the future non-performing loans also increases. Banks should stop taking over bad loans for higher loan growth from other banks.
Research question 2 recommendation
Based on the current condition of non-performing loans in the private commercial banks, this study suggest that banks should be prompt in recovering the funds blocked in the bad loan condition which will reduce the credit risk condition of the banks. Recovery of loans will also make the banks more liquid which will be helpful to meet the demand of the depositors.
In recent years, the effect of the rate of the national savings certificate (NSC) on the interest rates of the banks has become more visible in the economy. This concern is justified because when the NSC rate soars, the depositors withdraw fund from the banks to invest at the higher rate of the NSC, which creates a liquidity crisis in the banks. This recommendation is specifically towards the government side because the negative difference between the bank deposit rate and national savings certificate rate runs the possibility of rising of lending rate which could trigger non-performing loans in the long run. Currently, controlled interest rate policy (lending interest rate maximum 9% and deposit interest rate of inflation of immediate last 3 months) by Bangladesh Bank for scheduled commercial banks acting as a temporary solution.
Banks should maintain minimum spread in order to keep the lending rate at minimum so there is enough scope for any good borrowers to utilize the funds to contribute to the economy.
Bad loans that have been kept in the book for too long should be written-off because the extra provisions can make the profit of the banks decline and can make them aggressive to go for bad borrowers with higher lending rate.
Money Loan Court should be made more efficient in dealing with the non-performing loans quickly rather than extending time. The extra time makes the banks keep provision which is taken from the profit of the banks. Like said earlier that higher provision can induce the bank to go for borrowers with poor credit ratings.
From the empirical findings of this study, it is evident that bank should reduce the cost of fund and lending rates for bringing down the non-performing loans by creating market equilibrium situation between demand of loans and supply of deposit. In the market equilibrium situation, deposit rate will stay in a favorable position. Lesser rate of cost of the funds will reduce lending rate, which will encourages borrowers to keep their loans performing.
For reducing the cost of fund, banks should reduce operating expenses and cost of deposits. For minimizing non-performing loans, banks should be aware about the borrower's business operations and regularly follow up their financials and other indicators in a realistic manner.
A bank has to ensure that proper utilization of credit facility for which it is lent is actually carried down. Borrowers should only use the fund to finance the exact project, which was originally in the agreement. In this regard, banks should regularly monitor the activities of the borrowers to view the advancement of the projects.
The bank should take the initiative to develop specific tools and techniques to differentiate the willful defaulters from the genuine ones. For this Bangladesh Bank should give out criteria to be used by every banks with which they can identify the willful defaulters.
Banks should also stop unhealthy competition among themselves. Bangladesh Bank should strengthen the supervisory and credit risk monitoring functions and apply strict guidelines regarding interest rate spread for private commercial banks.
Banks should give incentives to borrowers with good credit rating in the form of reduced interest rate to motivate the other borrowers for making timely payments. Banks should also give recognition to good borrowers by bringing them into public attention.
In order to increase the liquidity of the banks, companies should be encouraged to execute all the transaction through banking channels and expand the agent banking/sub-branch facility to the remote corners of the country.
Collaboration among the Ministry of Finance, Bangladesh Bank, BSEC and other parties should be enhanced to reduce any trade and transaction barrier.
Research question 3 recommendation
This analysis recommends that government should start with simple existing problems rather than show off with sophisticated methods. Sophisticated approaches itself does not pose any problems but becomes ineffective when current problems sustain in the economy.
This study recommends that government should maintain hierarchy of activities in resolving the bad loan culture of Bangladesh.
Government should strive to remove corruption from the banking industry before opting for higher economic growth because in the presence of excessive corruption the achievement of the other sectors in terms of expansion in infrastructure can be over shadowed by the prevailing corrupt banking activities both in public and private banks.
Government must ensure business friendly environment for all people in general regardless of political affiliation. Innovation can come from variety of sources of people who could be at a disadvantage position for opening up a business for high entry barriers. These barriers can be in the form of highly politicized economic system where achieving a goal requires some form of political liaisons. If entry barrier prevails in the economy of Bangladesh, highly innovative business people who think in terms of long-term solution will be highly demotivated. As a consequence, short-minded politically affiliated business people will sustain to maximize profit in the short-term without considering public convenience. Thus, economy will be benefited in the short-term with the transient effect of high economic growth but will falter in the future due to not accommodating for highly innovative people who thinks for themselves as well as for the public.
Once again, the consistent prevalence of high corruption in Bangladesh does not make the economic condition to observe the effect of acute changes which has huge potential to change the course of the economy. There are important correlations between the NSC rate and the cost of fund which affects the lending rate of the banks. Therefore, any sort of inefficiency in the management policies as well as in the political system can make the effect of smaller impacts less visible which will creep up in the future to cause a havoc in the economic system. Government must immediately prioritize the economic and banking factors that has the potential to affect the economy both in the short and long-term. It is highly advisable that government should make economic models where qualitative factors along with quantitative factors are accommodated to make the effect of variables like cost of fund, political stability and others to forecast the approximate probability of the economic sensitivity. If certain effects are not accounted for then the government can have the wrong picture of the economy and only go in one direction without the consequence of making other factors stable.
Research question 4 recommendations
As the study pointed out towards the high non-performing loans of the public banks government should try to pinpoint the exact causes of the sharp rise in bad debts. Relative to the state-owned commercial banks the private banks have also experienced a decline in profitability in the recent years although not as much as the decline of the profitability of the state-owned banks. Proper authority should try to investigate the reason for the distinction to the exact level for bringing down the excessive non-performing loans in the public sector.
From the analysis of primary data, one of the important comparative factors between the public and private banks was the use of advanced technology. In general, the government banks are lagging behind in the use of advanced banking technologies. Due to their conventional banking approach, state-owned banks are not maintaining digitalized customer database system, better loan monitoring software modules and better customer information to make the appropriate decision regarding the loan selection and approval. State-owned banks of Bangladesh definitely should make comparative judgment between themselves and other bank group to reformulate their strategies regarding the old banking systems.
Many respondents in this study have mentioned about the willful defaulters ubiquitous prevalence in the public banking sector. In general, willful defaulters are those who have the ability to pay but does not have the intention to repay the bank loans. Compared to the private banks, the public banks are plagued with customers with bad loan history for which the image of the state-owned banks has not revitalized. Public banks should stop providing loan facility to the bad borrowers by properly analyzing the credibility of the clients in a consistent manner. Database for every willful defaulter should be maintained by every banks in the light of the any recent and potential scandals. Money loan court in this regard should be armed with necessary power to make appropriate judgments. To make the court more reliable and effective the Money Loan Court Act, 2003 should be amended. Furthermore, the capacity of the money loan court in terms of manpower and bench should also be enhanced to reduce the lengthy process of the legal course. The pending cases of the money loan court should be resolved at the earliest possible time through the modification of their existing capacity. Many countries have adopted sophisticated approaches to discourage the action of willful defaulters. Similarly, different restrictions must be adopted in our country also to change the attitude of such people. Restrictions in air flight and passport facilities with other lavish expenditures should be discouraged as the punishment of such illegal actions. These courses of actions taken against the corrupt personnel (willful defaulters) will create apprehension in the mind of any future willful defaulters.
In the last six to seven years, public banks have faced a number of incidents regarding fraudulence and corruption. Some defaulted borrowers have diverted huge amount of money from banks for personal gains and profits without considering the impact it would have on the economy. Furthermore, capital flights have taken place through many banks by over and under invoicing, false declaration on goods and services, etc. Some banks in this case have played an associative role to act with the bad intention of the borrowers. Management of some banks has been seriously influenced by the politicized system as well as by the internal corruption. Higher-level management officials in many banks have been found in collusion with the willful defaulters and corrupted political persons to afflict their bad intentions over the banking industry. Board members of banks have been found in many instances to be politically motivated and driven to make excessive loan sanctioning decisions for the benefits of the willful defaulters. Board members of the state-owned commercial banks have been found to be more politicized than that of the private commercial banks. Board members of such banks are connected with unethical politicians for which the willful defaulters get the audacity to act against the interest of the economy. In this regard, certain measures must be taken to depoliticize the board committee both in private and state-owned commercial banks. Members of the board must not be appointed through political collaboration rather through appropriate test, evaluation of their education, professional qualification and other matters. Board of directors must be appointed neutrally independent of political affiliation. In this regard, honest, wise and experienced bankers, financial planners, economists, university professor from relevant field should be elected for the positions of board of directors. Ministry of Finance must not exercise the power of appointing the board of directors or chairman of public banks. Rather a democratic participation from all the sides should be formulated to appoint the appropriate person with the above-mentioned criteria.
This study also recommends grading system for the MD and CEOs of the SCBs. Introduce performance incentive system based on profitability, leadership, innovativeness and long-term solutions for banks. Also, ensure proper accountability and efficiency of the board of directors.
Poor customer service has been a major criterion with which any public can identify a bank to be a state-owned. Moreover, state-owned banks have always been behind in branding and marketing their mission, vision and financial products. Compared to the private banks, the condition in the public banks has become worrisome for the low customer satisfaction and less marketing effort due to the way of banking of the public banks. So state-owned banks must regain the confidence of borrowers and depositors through flexible, well mannered and after banking service. As the depositors and borrowers are the focal point of the banking activities, state-owned commercial banks should leave-off their reactive attitude towards the customers to pick up a more pro-active manner in building long-term relationship with the clients and stakeholders.
State-owned commercial banks in particular should increase their experiences in the legal matters to overcome the ineffectiveness of the effort of loan recovery. Aside from the bank-specific effort to increase recovery, government should increase the bench and number of judges dealing with Money Loan Court Act, 2003 and Bankruptcy Act, 1997 for quickening the loan recovery by the bank management. In many cases, it has been found that borrowers exercise the option to use the stay-order from the court to delay the payment of loans. This causes the recovery process of the banks to slow down. Government should increase their effort to come to a decision regarding the pending issue of these stay-orders against the loans. Concerned authorities should give out final judgment regarding these stay-orders to remove the hassle of recovery from the shoulders of the banks.
As this study indicates, towards a huge amount of capital injections in the state-owned commercial banks, similar concern against the trend of loan write-off has also been portrayed. As more and more loans are being written-off from the balance sheet of the state-owned banks, government is recapitalizing to prevent those banks from going bankrupt. In this scenario, the politicized system comes into play. Most of the loans in the state-owned commercial banks are somehow related to political reference. The borrowers’ stakes are held by the capitalization of those banks because if enough capital is not injected into the banks then the profits of those borrowers will be at stake. Government should discontinue the capital injection into the state-owned banks and take exemplary legal actions against the willful loan defaulters.
Other recommendations
Developing tools to identify the credit rating of the individual borrowers: Bangladesh Bank should introduce individual credit rating before giving out any credit to individual borrowers. Although banks use CIB report to make judgment, individual credit report will reveal any collusion between any individual willful defaulters of the past. Individual credit rating can be tagged with the national ID card of the individuals.
Interacting with the borrowers to solve problems: It is not enough only to visit the client one or two times rather to solve any problems bank official must get out in the field to find out the exact problems that are causing the non-performance of the loans. Priority based meeting with the customer should be organized when banks feel the problem is getting out of hand. So face-to-face interaction with the borrowers is an essential step towards understanding any loan related problems to get to a fruitful solution for both parties.
Proper documentation: Before handing out any loans banks must go out of the ordinary procedures (if needed) to find out any documentation that will make the borrowers credibility more clear to the managements of the banks. All the documents required to prove a borrower’s credulity must be examined thoroughly to make judgmental values.
Early alert system: To track any problematic loans effectively and efficiently formulation of early alert system about the condition of loans must be taken into account. Early report about the bad condition of loans can be used to alert the branches to avoid non-performing loans.
Early resolution of court cases: Proper authority should make necessary steps to come to an early resolution for problematic loans.
Recovery of bad loans: Based on the current condition of non-performing loans in the banks this study suggest that banks should be prompt in recovering the funds blocked in the bad loan condition which will reduce the credit risk condition. Recovery of loans will also make the banks more liquid, which will be helpful to meet the demand of depositors. The legal team of the state-owned commercial banks should be more pro-active to recover the loans which have been in a non-performing state.
Appropriate rate of the savings certificate: Effect of NSC on the interest rate of the banks has been highlighted repeatedly. This concern is justified because when the NSC rate soars the depositors withdraw fund from the banks and this created liquidity crisis in the economy. This recommendation is specifically toward the government side because the difference between the cost of funds and NSC rate runs the possibility of rising lending rate which could trigger non-performing loans in the long run.
Minimizing the spread of the banks: Banks should maintain minimum spread in order to keep the lending rate at minimum so there is enough scope for any good borrowers to utilize the funds to contribute to the economy.
Flexible monetary policy: Bangladesh Bank should oversee that the monetary policy rate is properly adjusted in the market because many banks can exploit the higher lending rate or at least they could raise their lending rate for the overall cost of fund of the banking sector.
Timely loan write-off: Bad loans that have been kept in the book for too long should be written-off because the extra provisions can make the profit of the banks decline and can make them aggressive to go for bad borrowers with higher rate.
Efficiency of credit regulatory institutions: The Money Loan Court should be made more efficient in dealing with the non-performing loans quickly. The extra time makes the banks keep provision which is taking share from the profit of the banks.
Reduction of cost of fund: From our empirical findings, it is evident that bank should reduce the cost of fund and lending rates for bringing down the non-performing loans by creating market equilibrium situation between loan demand and supply of deposit. In the market equilibrium situation, deposit rate will stay in favorable position. Less cost of the fund will reduce lending rate which encourages borrowers to keep their loans regular and the bank can also drive for collect bad loans amount.
Flexible interest rate: For reducing the cost of fund, the bank should reduce operating expenses and cost of deposit subject to create available investment opportunity by the public and private sector in Bangladesh. For minimizing non-performing loans, bank should aware about the borrower's business operations and regularly follow up their financial and other indicators in a realistic manner. A bank has to ensure that proper utilization of credit facility that means under the purpose for which it is lent. Raise an early alert on the appropriate time for taking safeguard of the bank.
Strengthening monitoring: The bank should take the initiative to develop specific tools and techniques to differentiate the willful defaulters from the genuine ones. The bank should also stop unhealthy competition among them. Bangladesh Bank should strengthen the supervisory and credit risk monitoring functions and apply strict guidelines regarding interest rate spread for private commercial banks.
Creating loan monitoring cell: Each bank must implement proper loan monitoring cell for close inspection. In this regard, intelligent monitoring cell should be implemented in every banks and the easy writ facility should be stopped for the bad borrowers.
Proper investigation: The first and foremost strategy a bank can deploy to make their loans fruitful is to make proper investigation about the client and the business or the projects. If banks make proper investigation before giving out loan to the borrowers even at the expense of large expense, then the benefit will become visible in the long run. On the other hand, only by speculation or gaining information from the references cannot make all the loans viable. So finding out the correct information about the clients is a must in order to control the rise of non-performing loans.
Strenghten of asset management companies: Banks can sell their non-performing loans to the third parties such as to investors or to a special purpose securitization vehicle or to an asset management company (AMC). This way the third party can collect the money from the clients and it may turn out to be a positive scenario for the banks as well as for the third party.
Strong credit policy regarding collateral free loan for the politically exposed: Politically exposed people or those who have strong regional influence sometimes try to get collateral free loan by avoiding proposals. Banks should be strict in setting the standard for the credit assessment and collateral acceptance criteria.
Regular physical visits of the projects: The banks should inspect the client’s project more frequently.
Proper valuation of collateral and valuation policy: The banks should increase their valuation measure and their valuation policy regards to the collateral of the loans. Collateral must be properly valued in accordance with the laws of the country. Necessary margin of security must be taken to reflect such factors as the disposal costs or potential price movements of the underlying assets.
Political stability: Political environment should be stable for the regular day-to-day business activities. Without proper stability the progress of the economy becomes hampered, which lowers the profits of the companies and this reduces the chance of the companies to repay their loans to the banks.
According to this empirical analysis, the policy implication is strictly centered on the credit policy of banks at different time of economic growth. These actions and policies of banks regarding their loan appetite have the ability to affect the credit quality even in the longer time frame.
Research question 1 policy implications
The finding of this analysis suggests that excessive credit lending today has implications in the long run. When banks try to compete with other banks by raising the limit of the loans excessively, the risk associated with it gets absorbed not only in the short run but also in the long run. To be more specific, if banks include loans with poor quality in their portfolio, the risk not only can come up in the shorter time frame but also in the longer course of time. Higher risk through higher loan deposit ratio implies that banks must have some reasons to sanction loans by violating the prescribed loan-deposit ratio by Bangladesh Bank. This empirical analysis hints towards the credit policy of banks which has the potential to increase the risk and thus deteriorate the condition of loans.
The previously mentioned repercussion of arbitrary lending policy of banks brings about another finding of this paper. In Bangladesh, the effect of GDP is sluggish (details can be found in research question 1 interpretation) in terms of its effectiveness on the performance of banks as cited in many of the previous literatures. To be more specific, the effect of GDP growth does not immediately affect all the economic indicators. In times of good economic growth, banks have the tendency to give more loans particularly long-term loans to finance long run project due to the expectation of long lasting economic growth. This is true in terms of both good borrowers and bad borrowers because in good economic time bad borrowers may have access to credit facility along with the good borrowers. When the economy experiences a relatively low growth, the good borrowers may withstand the low growth or even cope with sudden shocks but the bad borrowers may not face the challenges that eventually increase the non-performing loans in the long run. In times when investment opportunity in industry and infrastructure is relatively scarce, offering excessive loan facility to the borrowers for long-term must be analyzed thoroughly otherwise banks may run into critical situation when the performance of the loans will be extremely poor.
Due to the impact of bank size, banks should reevaluate their lending policy and re-assess their ability and limit to disbursement loans every quarter based on their management capacity and capability. Every bank cannot just continually increase their loan growth rate without assessing the capacity of their ability to monitor and bear cost of evaluation. Government should continually assess the asset-liability management of banks to better understand the capacity at which each bank operates at different time frame.
Banks should pay more attention to their loan growth or investment growth in times of inflation. Banking policy should be reassessed when inflation rate changes because of its impact it could have on the interest rate.
Market power lowers the NPL ratio of banks in the short run in every model but becomes more significant in inflationary time. Again, lending policy seems to play a vital role in explaining the rise of non-performing loans in the longer time frame. Banking policy should include prudential regulation regarding excessive loans disbursement during boom period. Market power seems to be more significant in during economic growth, which has extremely important policy repercussions.
Research question 2 policy implications
National savings certificate (NSC) rate has important policy implications in determining the rate of cost of deposit of the banks. As the investment opportunity in Bangladesh is scarce in terms of financial instruments, people can deposit money in the banks, put money in the capital market, buy real estate properties or invest in the government financial instruments, etc. In Bangladesh, when the rate of NSC inclines it affects the cost of funds of the banks. People try to invest more in NSCs in this scenario. This forces the banks to increase the rate of the deposit rate which ultimately affects the lending rate. Lending rate inclines in this case and this puts pressure on the borrowers’ ability to pay back the loans in time. Government should address the issue of this mismatch between the NSC rate and bank deposits rate to create a more balanced environment where banks do not fall into a liquidity crisis. If this issue is not resolved, then banks run the risk of incurring non-performing loans for the higher lending rate.
Currently, the gap between the cost of fund and the lending rates of different banks vary by size and functionality. In an economy where every information regarding the investments rates are properly distributed, depositors will move only to those areas where the rate of return is higher. Borrowers will move only to those institutions where they will have to provide the lowest possible rate. For this information gap about the interest rates many inefficient banks gets funds in the form of deposits and others and give them as loans to stay in the market. Assuming every people knew what was going on in every parts of the economy banks could not have gained profit by charging rates other than the market equilibrium. If certain market cap for the spread of every banks were determined or imposed than the communication gap regarding the interest rates would have been neutralized. If Bangladesh Bank can create a similar interest spread cap for every banks (which every banks would have to abide by), then the banking industry will move to an equilibrium point where risk exposure regarding the cost to fund and lending rate would have been minimized.
Higher cost of fund has interesting implication in terms of its effect on the lending rate. The process through which the effect of a change of cost of fund occurs to affect the non-performing loans is of particular interest. The existing literature of interest rate suggests that higher cost of fund influences the lending rate and higher lending rate can affect the credit quality in the long run. In this regard, this study also found that the effect of cost of fund can be longer than usual which according to the literature if influences the lending rate can also influence the lending rate in the long run according to the findings of this paper. Banks should be alert on the sudden rise in cost of funds due to monetary policy and market competition.
Research question 3 policy implications
The implication the questionnaire survey, regarding the determinants of non-performing loans in Bangladesh constitutes a vast array of possibilities. The findings from the field survey report reveal the general perception of the bankers and borrowers. These findings may explain the ineffectiveness of Bangladesh’s economic growth that does not fully reflect the haphazard situation prevailing in the banking sector. In the Figure 6.4, the first six factors indicate the bank-specific variable that reveals the most important factors of rising bad loans in the banking sector of Bangladesh.
Interestingly, the effect of political instability has come after the banks’ specific inefficiencies. This reveals that even in the presence of politically stable environment, the inefficiencies of banks have covered the effect of a stable political scenario on business environment which otherwise could have affected the business in a less inefficient banking system. The inference of this understanding leads to the bad decision of government in fixing the bad loan culture of Bangladesh. When banking corruption is at its peak striving for higher economic growth without fixing the internal hazard will portray the wrong scenario of a country. The achievement of higher per capita income will be shadowed through the corruption of the banking system. In the context of Bangladesh, the political stability reflects the loan quality because of the nepotism and “political selection” culture. Most of the time, politically influenced person gets loan not because of their credit worthiness but because of their influence over the bank management which also can explain the factor of nepotism affecting the bad loans. When banks lend political influenced persons it can be considered as both nepotism and “political selection” which ultimately induces the possibility of delayed and irresponsible interest payments.
Likewise, the impact of bad business condition is not as much problematic as the problems of bank management and political influence according to the one-half of the respondents. This explains that there is a high business entry barrier in Bangladesh, which explains that new business or even existing businesses falter quickly because of their inability to stay ahead in the competition.
In terms of lending rate and cost of fund most of the respondents agreed that higher rate inclines the possibility of loan default because of “floating rate”. 36 percent either disagreed or stayed neutral which indicates that they may feel that there are other problems which are much more severe than the higher interest rate. It may be so but the criticality of higher interest rate becomes crucial and noticeable in certain economic conditions which otherwise may be elusive because of high persistence of corruption in the banking sector.
With the current amount of non-performing loans in the economy introduction of new banks can heighten the risk of non-performing loans. In the last five to six years deposit growth of the banking industry had been declining. According to Bangladesh Bank, in 2013 the deposit growth rate of the whole banking industry was 25.5 percent, which declined to 4.6 percent in 2017. As the major portion of the financing of the banking industry come from the deposit money, it could be detrimental to the banking sector to introduce new banks where enough supplies of deposits may not be feasible. In this scenario, more banks can increase the pressure on the banks, which can trigger the banks to go for poor quality of borrowers. Furthermore, it is advisable that bigger efficient banks takeover weaker inefficient banks to minimize the cost and the effect of non-performing loans on the economy. If performing banks take over the weaker banks then efficiency level of the banking industry has the possibility to get better.
Research question 4 policy implications
In this study, the analysis found that higher cost to income ratio (efficiency) does not significantly affect the profitability of the state-owned commercial banks. This has severe implications in the long run because of the regular capital injection by the government. If this continues in the future, huge amount of money will be diverted in the non-productive sectors of the country. For a developing country like Bangladesh, this type of extravagant injection for the unproductive investments could hamper the long-term development of the country.
This study proposes that willful defaulter gets the audacity to neglect the laws of borrowing through the liaison of corrupted bank officials and politicized economic system. If this continues, then in the long run, public welfare can be hindered and delayed. If proper identification of the willful defaulters to general defaulters is left unresolved then banks will always be in a risky situation of facing the non-performing loans in the future. Bangladesh Bank and other regulatory authorities should set up policies and criteria for identifying the willful defaulters. Based on the policies and criteria, banks should create separate databases of willful defaulters and send that information to Bangladesh Bank for further assessment. Bangladesh Bank and others regulatory authorities should create separate database from which all the banks can gain information about the credibility of the borrowers. If any borrower is identified as willful in nature, it should be mentioned in CIB report. Furthermore, no additional credit facilities will be approved by the banks and financial institutions to the willful defaulters as appearing in the list provided by Bangladesh Bank. In the similar manner, family members of the willful defaulter should also be prohibited from getting any loans from any financial institutions.
Banking reform commission should be introduced to protect and promote the welfare of banks and other stakeholders. This commission should also strive to make the banking sector more transparent and responsible. Committee members of the reform commission should not be selected based on any political affiliation. Moreover, the members must have social acceptability and impartial position in the country. Adopting the banking reform commission can increase the credibility and ethical nature of the banking industry, which has the potential to bring down non-performing loans.
This research found insignificant relationship between loan recovery and profitability of the state-owned banks. This is due to the mismatch of loan write-off and loan recovery. As the loan write-off to loan recovery increases the effect of recovering loans become negligible. If this continues then the government will have to spend extra amount of resources from the taxpayers’ money and thus will slowdown economic growth. In this regard, the pending cases due to loan default should be resolved as quickly as possible to increase the recovery of bad loans of the banks.
Government should increase the bench and number of judges dealing with Money Loan Court Act, 2003 and Bankruptcy Act, 1997 for quickening the loan recovery by the bank management. Furthermore, Money Loan Court Act (2003) and Bankruptcy Act, 1997 should be amended to impel the process of loan recovery. Special benches should be added to the court to resolve the long-term pending cases, which will improve the recovery rate of the banks.
State-owned commercial banks are constantly struggling with non-performing loans and increasing the risk of plundering the depositors money. This study suggests that government should take the policy for the interim period that state-owned banks should only collect deposits from the market to give out as loans only in the inter-bank market to reduce the risk of plundering public money. If this is properly implemented then the recapitalization that takes place each year will not be necessary and thus a huge amount of tax money will be saved.
Further research can be done in understanding any other macroeconomic and bank-specific factors that might be effective in a particular time frame.
As this study found the significant effect of lagged per-capita GDP on the loan quality it is possible to find other important effect of GDP on different categories of loans.
The effect of tax on the quality of loans should be rigorously investigated controlling for important macroeconomic factors.
Studies are also needed on actual loan wise lending rates and net non-performing loans to identify the levels of provision among commercial banks.
In future, the relationship between the monetary policy transmission mechanism and the non-performing loans should be undertaken to better understand the effects of government and central bank’s policy on the credit risk of the banking sector.
Another study on cost of fund and non-performing loans can be conducted on a cross-country basis to understand the effects of a country’s cost of fund on the asset quality.
Comparative analysis can be conducted between different bank groups like foreign bank & state-owned banks and foreign banks & local banks.
Econometric analysis in determining the factors of non-performing loans of the Islamic banks in particular can be conducted.
Econometric analysis through static model and dynamic model can be simultaneously conducted to find out any “model specific findings” which could be possibly missing if conducted with only one model. The distinction can be used to find out the exact model through which the banking sector in Bangladesh evolves.
Same analysis could be run with different models to understand the result or different results (if any) to better interpret the findings to come to a new way of understanding of the economic phenomenon.
The book is the outcome of the original research work under the title “A Comparative Study on Non-Performing Loans of Selected State-owned and Private Commercial Banks in Bangladesh” provided a thorough and proliferated picture of the non-performing loans in Bangladesh. The discussion focused on the changing trend of non-performing loans within this time frame. Primarily, the thesis focused on questionnaire survey from which various determinants of non-performing loans were identified. Subsequently, secondary data were used to focus on the change of “non-performing loans to the total loans and advances” from which the long-term effect of credit growth on asset quality was identified and the national scenario of the quality of loans were also discussed in this research.
To provide a comparative picture among the neighboring nations the condition of the non-performing loans were also portrayed for the SAARC nation from 2011 to 2020. For this same time frame, the position of non-performing loans were also discussed for the OECD countries.
To provide a theoretical framework, the significance of credit growth, cost of funds, efficiency (in terms of operating cost to income), loan write-off and loan recovery for different categories of banks were also analyzed.
After analyzing the impact of non-performing loans on the various aspects of country and bank economy, the following research questions were formulated:
What are the effects of excessive credit growth on the long run credit quality?
What are the effects of cost of fund on non-performing loans both in the short and long run?
What are the determinants of non-performing loans from the perspective of bankers and borrowers of Bangladesh?
What are the comparative factors that differentiate the state-owned banks from the private commercial banks?
The above research questions were subsequently transformed into hypotheses and the hypotheses were analyzed with primary and secondary data collected from questionnaire survey and annual reports.
The qualitative data was collected through questionnaire survey from the view point of bankers and borrowers. The quantitative analysis regarding the determinants of non-performing loans has been done on a panel data set of 16 conventional private commercial banks of Bangladesh from 2006 to 2017. Moreover, the comparison between the state-owned and the private commercial banks has been done on a panel dataset of randomly selected 5 public banks and 16 private banks for the time period of 2009 to 2017.
Current scenario of non-performing loans in Bangladesh
The present situation of the rising non-performing loans in Bangladesh has been supplemented by the outbreak of COVID-19 pandemic. The chart shows the NPL ratio up to September 2021. As of 2018, the NPL ratio maintained its rising trend and climbed to 10.3 percent. At the end of December 2019, the NPL ratio plummeted to 9.3 percent. This was due to the large amount of loan write-off by the banks in general. A total of Tk 560.16 billion has been written-off as of December 2019 since the facility was introduced in January 2003. This trend was before the outbreak of the COVID-19.
Figure 10.1: History of NPL in Bangladesh
(June 2011 – September 2021)
🔍 Tap to enlarge
Figure 10.1
Source: World Bank.
According to Bangladesh Bank, as of September 2021 the cumulative amount of non-performing loans stood at Tk. 1033 billion. This amount declined to Tk. 887 billion in December 2020. After that, it started climbing again.
Although the NPLs have increased up to 2018 at an alarming rate the decline in NPL ratio in Dec 2019 can be attributed to the rigorous administration by Bangladesh Bank, improved monitoring from banks, and restructuring of loans under new policy aimed at reducing debt burden of good borrowers. At the end-December 2019, total rescheduled loans stood at 14.1 percent of banking sector’s total outstanding loans. 79.6 percent of that rescheduled loans remained unclassified (Bangladesh Bank, 2020). In the beginning of 2020, the banking industry faced another challenge of the outbreak of coronavirus pandemic. To maintain stability in the economy, government and Bangladesh Bank since then, had taken many initiatives to tackle the condition of outstanding loans particularly for the widespread condition of COVID-19 in Bangladesh.
Figure 10.2: NPL of Bangladesh in cumulative amounts (Jun, 1998-September 2021)
Source: Bangladesh Bank annual and quarterly report
The severity of non-performing loans in Bangladesh can further be understood by the huge amount loans write-offs each year. According to Bangladesh Bank, as of September 2021, total loan write-offs stood at Tk 436 billion. If this amount was not written-off from the banking books, then the NPL amount would have been much higher.
During the fiscal year of 2018, the total NPL amount rose by Tk. 184 billion. As of September 2021, amidst the critical situation of COVID-19, the non-performing loans in the banking sector of Bangladesh stood at Tk. 1033 billion which was 8.73 percent of the total disbursed loans, according to the report by Bangladesh Bank. Before the outbreak of COVID-19, as of December 2019, total NPL amount was around Tk. 943 billion which was an all-time high figure in the history of the banking sector. Although this amount dropped to Tk. 887 billion in December 2020 due to the due to allowing different facilities by Bangladesh Bank such as flexible loan repayment, payment pause facility, loan validity extention, flexible rescheduling terms, financial stimulus packages, temporary bar on loan classification etc, since the subsequent coronavirus outburst severely affected the NPL condition of the country. Even in the lenient position of loan rescheduling, non-performing loans increased by Tk. 145.44 billion from December 2020 to September 2021. The NPL ratio of SCBs decreased to 20.10 percent at September 2021 (particularly due to loan write-offs and allowing different facilities by Bangladesh Bank). DFIs NPL ratio dropped to reach 11.4 percent. Despite these improvements, the NPL ratios remained high for both categories of banks, which affected the overall asset quality of the industry. The NPL ratio of the PCBs increased to 5.5 percent while the same for FCBs stood at 4.1 percent at September 2021.
Bangladesh has been heavily affected by the coronavirus pandemic. At a time when the whole world was suffering from the COVID-19 crisis, economies around the world came to a halt. Many cities around the world were under heavy surveillance and lockdown. This suffocating situation has severely injured the health of the financial institutions around the world. In Bangladesh, this halted socio-economic condition supplemented with fear, anxiety and uncertainty of the future has devastated the business condition. The already prevailing high non-performing loans is surely to be negatively affected in the coming days. Various research has shown that, the effect of a banking crisis does not immediately show up in the running year rather they rise at modest level and rapidly climbs around.
In these difficult times, the anticipation of future levels of NPLs should be the key strategies. Pre-crisis NPLs should not be used as the forecasting criteria rather lessons from the previous crisis should be researched and studied to formulate effective plans. It is imperative that proper monitoring of all types of loans with special emphasis to rescheduled loans amidst the COVID-19 pandemic be supervised by Bangladesh Bank and Government to reduce the detrimental effect of coronavirus spread in the banking industry. In this regard, Bangladesh Bank prohibited banks not to classify any loans from January–December 2020 in order to help business people fight the economic fallout of COVID-19. Besides Bangladesh Bank and Government has provided stimulus packages and other flexibilities to repay the loan to help the businesses run smoothly in this fatal situation.
Figure 10.3: NPL percentage (%) to total loans of the SAARC (2011–2020)
🔍 Tap to enlarge
Figure 10.2
Source: World Bank.
It is apprehended that due to the special facilities provided by Bangladesh Bank in loan repayments and classification the true picture of NPLs may not be clear in the recent years rather it may take some time. If the economy does not recover from the coronavirus pandemic, there is a huge possibility that this flexibility may increase the NPLs towards the last quarter of 2022 and onwards. In this regard, proper monitoring of rescheduled loans amid the COVID-19 pandemic will be a critical challenge for the banking industry.
Additionally, Bangladesh Bank and Government should take necessary steps in benefiting the good borrowers and taking stringent measures against willful defaulters to combat the high level of NPLs in the economy. In this coronavirus pandemic, it should be stressed to the utmost level that good borrowers are not penalized for the willful defaulting of bad borrowers.
This book “Non-performing Loans in Bangladesh: A Comparative Study on Non-performing Loans of Selected State-owned and Private Commercial Banks” has put forward the scenarios of non-performing loans to better equip the banking industry in combating NPLs. Furthermore, this book has portrayed the comparative analysis of different banking groups to provide viable solutions in coping with the upcoming challenges amidst COVID-19.
Abid, L., Ouertani, M. N., &Zouari-Ghorbel, S. (2014). Macroeconomic and bank- specific determinants of household's non-performing loans in Tunisia: A dynamic panel data. Procedia Economics and Finance, 13, 58-68. Retrieved from
Adebola, S. S., Yusoff, W. S. W., &Dahalan, J. (2011). The impact of macroeconomic variables on Islamic banks financing in Malaysia. Research Journal of Finance and Accounting, 2(4), 22-32. Retrieved from
Adhikary, B. K. (2006). Nonperforming loans in the banking sector of Bangladesh: realities and challenges. Bangladesh Institute of Bank Management, 75-95. Retrieved from
Alam, S., Haq, M. M., & Kader, A. (2015). Non-Performing Loan and Banking Sustainability Bangladesh Perspective. International Journal of Advance Research, 8, 1197- 1210. Retrieved from
Ahmad, F., & Bashir, T. (2013). Explanatory power of bank-specific variables as determinants of non-performing loans: Evidence from Pakistan banking sector. World Applied Sciences Journal, 22(9), 1220-1231. Retrieved from
Alexandri, M. B., & Santoso, T. I. (2015). Non-Performing Loan: Impact of Internal and External Factor (Evidence in Indonesia). Abstrak.
Amidu, M. (2006). The link between monetary policy and banks’ lending behaviour: the Ghanaian case. Banks and Bank Systems, 1(4), 38-48. Retrieved from
Amuakwa–Mensah, F., &Boakye–Adjei, A. (2014). Determinants of non–performing loans in Ghana banking industry. International Journal of Computational Economics and Econometrics, 5(1), 35-54. Retrieved from
Anderson, T.W. and Hsiao, C., 1982. Formulation and estimation of dynamic models using panel data. Journal of econometrics, 18(1), pp.47-82. Retrievedfrom
Ani, W. U., Ugwunta, D. O., Ezeudu, I. J., &Ugwuanyi, G. O. (2012). An empirical assessment of the determinants of bank profitability in Nigeria: Bank characteristics panel evidence. Journal of Accounting and Taxation, 4(3), 38. Retrieved from https://doi. org/10.5897/JAT11.034
Anjom, W., & Karim, A. M. (2016). Relationship between non-performing loans and macro economic factors with bank-specific factors: a case study on loan portfolios– SAARC countries perspective. Elk Asia Pacific Journal of Finance and Risk Management, 7(2), 1-29. Retrieved from
Arellano, M., & Bond, S. (1991). Some tests of specification for panel data: Monte Carlo evidence and an application to employment equations. The review of economic studies, 58(2), 277-297. Retrieved from
Athanasoglou, P.P., Brissimis, S.N., & Delis, M.D. (2008). Bank-specific, industry-specific and macroeconomic determinants of bank profitability. Journal of international financial Markets, Institutions and Money, 18(2), 121-136. Retrieved from
Balasubramaniam, C. S. (2012). Non-performing assets and profitability of commercial banks in India: assessment and emerging issues. National Monthly Refereed Journal of Research in Commerce & Management, June, volume, (1), 41-52. Retrieved from http:// www.abhinavjournal.com
Baltagi, B., 2008. Econometric analysis of panel data. John Wiley & Sons.
Barisitz, S. (2013). Nonperforming Loans in CESEE–An Even Deeper Definitional Comparison. Focus on European Economic Integration Q, 3, 64-81. Retrieved from
Berger, A. N., & DeYoung, R. (1997). Problem loans and cost efficiency in commercial banks. Journal of Banking &Finance, 21(6), 849-870. Retrieved from
Bhattacharya, U., & Ravikumar, B. (2001). Capital markets and the evolution of family businesses. The Journal of Business, 74(2), 187-219. Retrieved from
Bhattarai, S. (2016). Determinants of Non-Performing Loans: Perception of Nepali Bankers. Economic Journal of Development Issues, 17(1-2), 128-148. Retrieved from http://dx.doi. org/10.3126/ejdi.v17i1-2.14524
Bofondi, M., &Ropele, T. (2011). Macroeconomic determinants of bad loans: evidence from Italian banks. Retrieved from http://dx.doi.org/10.2139/ssrn.1849872
Boudriga, A., BoulilaTaktak, N., &Jellouli, S. (2009). Banking supervision and nonperforming loans: a cross-country analysis. Journal of financial economic policy, 1(4), 286-318.Retrieved from
Boomsma, A. (1983). On the robustness of LISREL (maximum likelihood estimation) against small sample size and non-normality (Doctoral dissertation, Rijksuniversiteit Groningen). Retrieved from
Bozdo, A., & Kripa, E. (2015). The impact of macro-economic factors on non-performing loans in albania. Academic Journal of Interdisciplinary Studies, 4(3 S1), 534. Retrieved from 10.5901/ajis.2015.v4n3s1p534
Brock, P. L., & Suarez, L.R. (2000). Understanding the behavior of banks preadsin Latin America. Journal of development Economics, 63(1), 113-134. Retrieved from https://doi. org/10.1016/S0304-3878(00)00102-4
Brochard, A. (2017, September 21). EUROPE’S NON-PERFORMING LOANS: AN ITALIAN PROBLEM. Retrieved from
Caprio, G., &Klingebiel, D. (2002). Episodes of systemic and borderline banking crises. Managing the real and fiscal effects of banking crises, World Bank Discussion Paper, 428, 31-49. Retrieved from https://doi.org/10.1596/0-8213-5056-0
Chaibi, H. (2016). Determinants of Problem Loans: Non-performing Loans vs. Loan Quality Deterioration. International Business Research, 9(10), 86. Retrieved from
http:// dx.doi.org/10.5539/ibr.v9n10p86
Chand, S., 2002. Financial Sector Development and Economic Growth in Pacific Island Countries. Pacific Economic Bulletin, 17(1), 117-133. Retrieved from
Chaudhary, K., & Sharma, M. (2011). Performance of Indian public sector banks and private sector banks: A comparative study. International journal of in novation, management and technology, 2(3), 249. Retrieved from
Chege, M. (2014). Effect of Interest Rateson Non-performing Loansin Commercial Banks in Kenya. Unpublished Masters. University of Nairobi. Retrieved from
Choudhury, T. A., & Adhikary, B. K. (2002, January). Loan Classification, Provisioning Requirement and Recovery Strategies: A comparative Study on Bangladesh and India. In Seminar Paper, Bangladesh Institute of Bank Management, January (pp.21-54).
Cooper, D. R., Schindler, P. S., & Sun, J. (2006). Business research methods (Vol. 9). New York: McGraw-Hill Irwin. Retrieved from
Creswell, J. W., & Creswell, J. D. (2017). Research design: Qualitative, quantitative, and mixed methods approaches. Sage publications. Retrieved from http://www.ceil-conicet.gov. ar/wp-content/uploads/2015/10/Creswell-Cap-10.pdf
Creswell, J. W., & Clark, V. L. P. (2007). Designing and conducting mixed methods research. Retrieved from
Ćurak, M., Pepur, S., & Poposki, K. (2013). Determinants of non-performing loans–evidence from Southeastern banking systems. Banks & Bank System, 8(1), 45-54. Retrieved from https://bib.irb.hr/prikazi-rad?rad=676007
Daumont,R.,Le Gall,F.,&Leroux,F.(2004).Bankinginsub-SaharanAfrica:whatwent wrong? (No. 2004-2055). International Monetary Fund. Retrieved from
Dimitrios, A., Helen, L., & Mike, T. (2016). Determinants of non-performing loans: Evidence from Euro-area countries. Finance research letters, 18, 116-119. Retrieved from https://doi.org/10.1016/j.frl.2016.04.008
Dumitrescu, E.I., & Hurlin, C. (2012). Testing for Grangernon-causality in heterogeneous panels. Economic Modelling, 29(4), 1450-1460. Retrieved from
Ekanayake, E. M. N. N., & Azeez, A. A. (2015). Determinants of non-performing loans in licensed commercial banks: Evidence from Sri Lanka. Asian Economic and Financial Review, 5(6), 868. Retrieved from
Espinoza, R. A., & Prasad, A. (2010). Nonperforming loans in the GCC banking system and their macroeconomic effects (No. 10-224). International Monetary Fund. Retrieved from
Farhan, M., Sattar, A., Chaudhry, A. H., & Khalil, F. (2012). Economic determinants of non-performing loans: perception of Pakistani bankers. European journal of business and management, 4(19),87-99.
Festić, M., Repina, S., &Kavkler, A. (2009). The overheating of five EU new member states and cyclicality of systemic risk in the banking sector. Journal of business economics and management, 10(3), 219-232. Retrieved from
Firmansyah, I. (2014). Determinant of non-performing loan: The case of Islamic bank in Indonesia. Buletin Ekonomi Moneterdan Perbankan, 17(2), 241-258. Retrieved from
https:// doi.org/10.21098/bemp.v17i2.51
Filip, B. F. (2014). Non-performing loans-dimension of the non-quality of bank lending/ loans and their specific connections. Theoretical and Applied Economics, 5(594), 127-146. Retrieved from http://store.ectap.ro/articole/987.pdf
Fofack, H. L. (2005). Nonperforming loans in Sub-Saharan Africa: causal analysis and macroeconomic implications. The World Bank. Retrieved from
Fonseca, A. R., & González, F. (2010). How bank capital buffers vary across countries: The influence of cost of deposits, market power and bank regulation. Journal of banking & finance, 34(4), 892-902. Retrieved from
Ghosh, A. (2015). Banking-industry specific and regional economic determinants of non-performing loans: Evidence from US states. Journal of Financial Stability, 20, 93-104. Retrieved from https://doi.org/10.1016/j.jfs.2015.08.004
Gonzalez-Hermosillo, B., Pazarbaşioğlu, C., & Billings, R. (1997). Determinants of banking system fragility: A case study of Mexico. Staff Papers, 44(3), 295-314. Retrieved from
Goldstein, M., &Turner, P. (1996). Banking crises in emerging economies: origins and policy options. In BIS Economic Paper 46. Bank for International Settlements, Monetary and Economic Department, Basle. Retrieved from
Granger, C. W. (1969). Investigating causal relations by econometric models and cross- spectral methods. Econometrica: Journal of the Econometric Society, 424-438. Retrieved from https://www.jstor.org/stable/1912791
Greenidge, K., & Grosvenor, T. (2010). FORECASTING NON-PERFORMING LOANS IN BARBADOS. Journal of Business, Finance & Economics in Emerging Economies, 5(1). Retrieved from
Guadagnoli, E., & Velicer, W.F. (1988). Relation to sample size to the stability of component patterns. Psychological bulletin, 103(2), 265. Retrieved from
Haneef, S., Riaz, T., Ramzan, M., Rana, M.A., Hafiz, M.I., & Karim, Y. (2012). Impact of risk management on non-performing loans and profitability of banking sector of Pakistan. International Journal of Business and Social Science, 3(7). Retrieved from
Hossain, M. (2012). Financial reforms and persistently high bank interest spreads in Bangladesh: Pitfalls in institutional development? Journal of Asian Economics, 23(4),395-408. Retrieved from https://doi.org/10.1016/j.asieco.2011.12.002
Hox, J. J., Moerbeek, M., & van de Schoot, R. (2010). Multilevel analysis: Techniques and applications. Routledge. Retrieved from
Irungu, P. N. (2013). The effect of interest rate spread on financial performance of commercial banks in Kenya. Unpublished Master’s Thesis, University of Nairobi.
Jesus, S., & Gabriel, J. (2006). Creditcycles, credit risk, and prudential regulation. Retrieved from
Jiménez, G., Ongena, S., Peydró, J.L., & Saurina, J. (2014). Hazardous times for monetary policy: What do twenty‐three million bank loans say about the effects of monetary policy on credit risk‐taking?. Econometrica, 82(2), 463-505. Retrieved from https://doi.org/10.3982/ ECTA10104
Johnson, R.B., Onwuegbuzie, A.J., & Turner, L.A. (2007). Toward a definition of mixed methods research. Journal of mixed methods research, 1(2), 112-133. Retrieved from
https:// doi.org/10.1177/1558689806298224
Judson, R., & Owen, A.L. (1997). Estimating dynamic panel data models: A practical guide for macroeconomists (No. 1997-3). Board of Governors of the Federal Reserve System (US). Retrieved from
Karim, M. Z. A., Chan, S. G., & Hassan, S. (2010). Bank efficiency and non-performing loans: Evidence from Malaysia and Singapore. Prague Economic Papers,2(2010), 118-132. Retrieved from
Keeton, W.R. (1999). Does faster loan growth lead to higher loan losses?. Economic review- Federal reserve bank of Kansas City, 84, 57-76. Retrieved from
Kithinji, A.M., & Waweru, N.M. (2007). Merger restructuring and financial performance of commercial banks in Kenya. Journal of Economics, management and financial markets, 2(4),10-32.
Klein, N. (2013). Non-performing loans in CESEE: Determinants and impact on macroeconomic performance (No. 13-72). International Monetary Fund. Retrieved from https://www.imf. org/external/pubs/ft/wp/2013/wp1372.pdf
Kotzab, H., Seuring, S., Müller, M., & Reiner, G. (Eds.). (2006). Research methodologies in supply chain management. Springer Science & Business Media.
Lata, R. S. (2015). Non-Performing Loan and Profitability: The Case of State-owned Commercial Banks in Bangladesh. World Review of Business Research, 5(3), 171-182. Retrieved from http://www.wrbrpapers.com/static/documents/September/2015/12. %20Rabeya.pdf
Leedy, P. D., & ORMROD, J. (2005). Practical Research–Planning and Design 8th edn Pearson. Upper Saddle River, NJ.
Levine, R., &Zervos, S. (1998). Stock markets, banks, and economic growth. American economic review, 537-558.
Lind, D. A., Marchal, W. G., Wathen, S. A., &Waite, C. A. (2000). Basic statistics for business and economics (pp. 356-368). Boston: Irwin/McGraw-Hill.
Lis, F. S., Pagés, J. M., &Saurina, J. (2001). Credit growth, problem loans and credit risk provisioning in Spain. bis Papers, 1, 331-353. Retrieved from
Louzis, D. P., Vouldis, A. T., & Metaxas, V. L. (2012). Macroeconomic and bank-specific determinants of non-performing loansin Greece: A comparative study of mortgage, business and consumer loan portfolios. Journal of Banking & Finance, 36(4), 1012-1027. Retrieved from
Marsh, H. W., Balla, J. R., & McDonald, R. P. (1988). Goodness-of-fit indexes in confirmatory factor analysis: The effect of sample size. Psychological bulletin, 103(3),391. Retrieved from
Makri, V., Tsagkanos, A., & Bellas, A. (2014). Determinants of non-performing loans: The case of Eurozone. Panoeconomicus, 61(2), 193-206. Retrieved from
Messai, A.S., & Jouini, F. (2013). Micro and macro determinants of non-performing loans. International journal of economics and financial issues, 3(4), 852-860. Retrieved from
Minton, B. A., Stulz, R., & Williamson, R. (2009). How much do banks use credit derivatives to hedge loans?. Journal of Financial Services Research, 35(1), 1-31 Retrieved from
Mondal, T. (2016). Sensitivity of Non-Performing Loan to Macroeconomic Variables: Empirical Evidence from Banking Industry of Bangladesh. Global Journal of Management And Business Research. Retrieved from
Murthy, U., Kamil, N. M., Mariadas, P. A., & Devi, D. (2017). Factors Influencing Non-Performing Loans in Commercial Banks: The Case of Banks in Selangor. International Journal of Business and Management, 12(2), 246. Retrieved from
Muye, I. M., &Muye, I. Y. (2017). Testing for causality among globalization, institution and financial development: Further evidence from three economic blocs. Borsa Istanbul Review, 17(2), 117-132. Retrieved from
Ng’etich Joseph Collins, K. W. (2011). The effects of interest rate spread on the level of non-performing assets: A case of commercial banks in Kenya. International Journal of Business and Public Management (ISSN: 2223-6244) Vol, 1(1), 58-65. Retrieved from
Nkurrunah, N. (2014). Factors Affecting Non-Performing Loans: A Case Study ofCommercial Bank of Africa–CBA (Kenya) (Doctoral dissertation, United States International University- Africa). Retrieved from
Nkusu, M. M. (2011). Nonperforming loans and macro financial vulnerabilities in advanced economies (No. 11-161). International Monetary Fund. Retrieved from
Ongore, V.O., & Kusa, G.B. (2013). Determinants of financial performance of commercial banks in Kenya. International Journal of Economics and Financial Issues, 3(1), 237-252. Retrieved from
Pavloska-Gjorgjieska, D., & Stanojevic, J. (2015). Non-Performing Loans In The Banking Systems Of Serbia, Croatia And Macedonia: Comparative Analysis (No.2015-01). Ekonomika “Society of Economists, Niš (Serbia). Retrieved from
Phuong, H. K. (2014). Determinants of non-performing loans: A comparative study between state-owned commercial banks and joint stock commercial banks in Vietnam (Doctoral dissertation, International University HCMC, Vietnam). Retrieved from
Rahman, R. A., & Anwar, I. S. K. (2014). Effectiveness of fraud prevention and detection techniques in Malaysian Islamic banks. Procedia-Social and Behavioral Sciences, 145,97-102.
Rahman, M.A., Asaduzzaman, M., & Hossin, M.S. (2016). Impact of Financial Ratioson Non-Performing Loans of Publicly Traded Commercial Banks in Bangladesh. International Journal of Financial Research, 8(1), 181. Retrieved from
Rajan, R., & Dhal, S.C. (2003). Non-performing loans and terms of credit of public sector banks in India: An empirical assessment. Reserve Bank of India Occasional Papers, 24(3), 81-121. Retrieved from
Rajha, K.S. (2016). Determinants of Non-Performing Loans: Evidence from the Jordanian Banking Sector. Journal of Finance and Bank Management, 4(1), 125-136. Retrieved from https://doi.org/10.15640/jfbm.v4n1a9
Rifat, A. M. An Analytical Study of Determinants of Non-Performing Loans: Evidence from Non-Bank Financial Institutions (NBFIs) of Bangladesh. Journal of Business and Technology(Dhaka),11(1),55-67. Retrieved from
Rinaldi, Laura and Sanchis-Arellano, Alicia, House hold Debt Sustainability: What Explains Household Non-Performing Loans? An Empirical Analysis (January 2006). ECB Working Paper No. 570. Available at SSRN:
Saba, I., Kouser, R., & Azeem, M. (2012). Determinants of Non-Performing Loans: Case of US Banking Sector. The Romanian Economic Journal, 44(6), 125-136. Retrieved from
Sandelowski, M. (1995). Sample size in qualitative research. Research in nursing & health, 18(2), 179-183. Retrieved from https://doi.org/10.1002/nur.4770180211
Sensarma, R. (2006). Are foreign banks always the best? Comparison of state-owned, private and foreign banks in India. Economic Modelling, 23(4), 717-735. Retrieved from https://doi.org/10.1016/j.econmod.2006.04.002
Škarica, B. (2014). Determinants of non-performing loans in Central and Eastern European countries. Financial theory and practice, 38(1), 37-59. Retrieved from https://doi.org/10.3326/ fintp.38.1.2
Sheefeni, J. P., & Nyambe, J. M. (2016). MACROECONOMIC DETERMINANTS OF COMMERCIAL BANKS’LIQUIDITY IN NAMIBIA. EuropeanJournalofBusiness, Economics and Accountancy, 4(5), 19-30. Received from
Shu, C. (2002). The impact of macroeconomic environment on the asset quality of Hong Kong’s banking sector. Hong Kong Monetary Authority Research Memorandum, 20, 2002. Retrieved from
Suryanto, S. (2015). Non-Performing Loanson Regional Development Bank in Indonesia and Factors that Influence. Mediterranean Journal of Social Sciences, 6(4), 280. Retrieved from DOI:10.5901/mjss.2015.v6n4p280
Tanasković, S., & Jandrić, M. (2015). Macroeconomic and institutional determinants of non-performing loans. Journal of Central Banking Theory and Practice, 4(1), 47-62. Retrieved from
Vogiazas, S.D., & Nikolaidou, E. (2011). Investigating the determinants of nonperforming loans in the Romanian banking system: An empirical study with reference to the Greek crisis. Economics Research International, 2011. Retrieved from
Waqas, M., Fatima, N., Khan, A., &Arif, M. (2017). Determinants of Non-performing Loans: A Comparative Study of Pakistan, India, and Bangladesh. International Journal of Finance & Banking Studies, 6(1), 51. Retrieved fromDOI:10.20525/ijfbs.v6i1.617
Washington, G.K. (2014). Effects of macroeconomic variables on credit risk in the Kenyan banking system. International Journal of Business and Commerce, 3(9), 1. Retrieved from
Zia, M.D., & e Huma, Z. (2015). Determinants of Non-Performing Loan. RADS Journal of Social Sciencess& Business Management, 2(1), 01-14. Retrieved from
Zeng, S. (2012). Bank non-performing loans (NPLS): A dynamic model and analysis in China. Modern Economy, 3(01), 100. Retrieved from


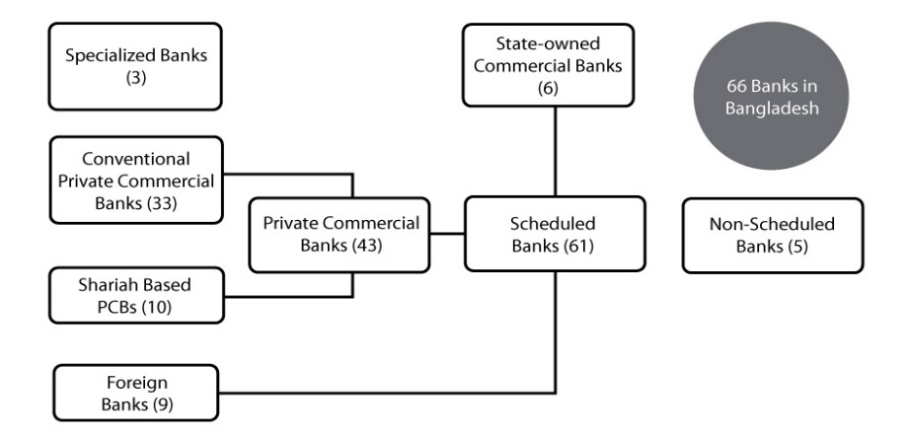 🔍 Tap to enlarge
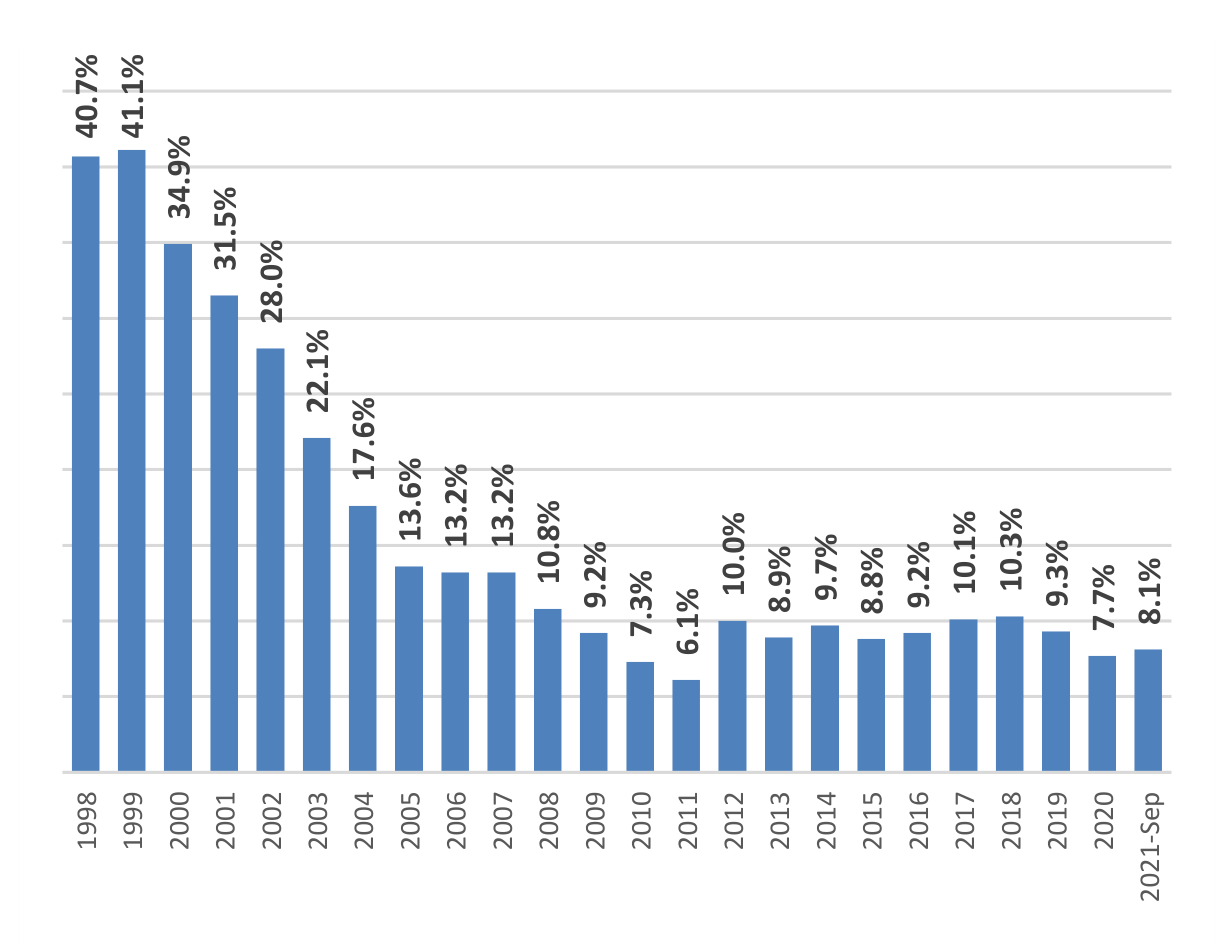 🔍 Tap to enlarge
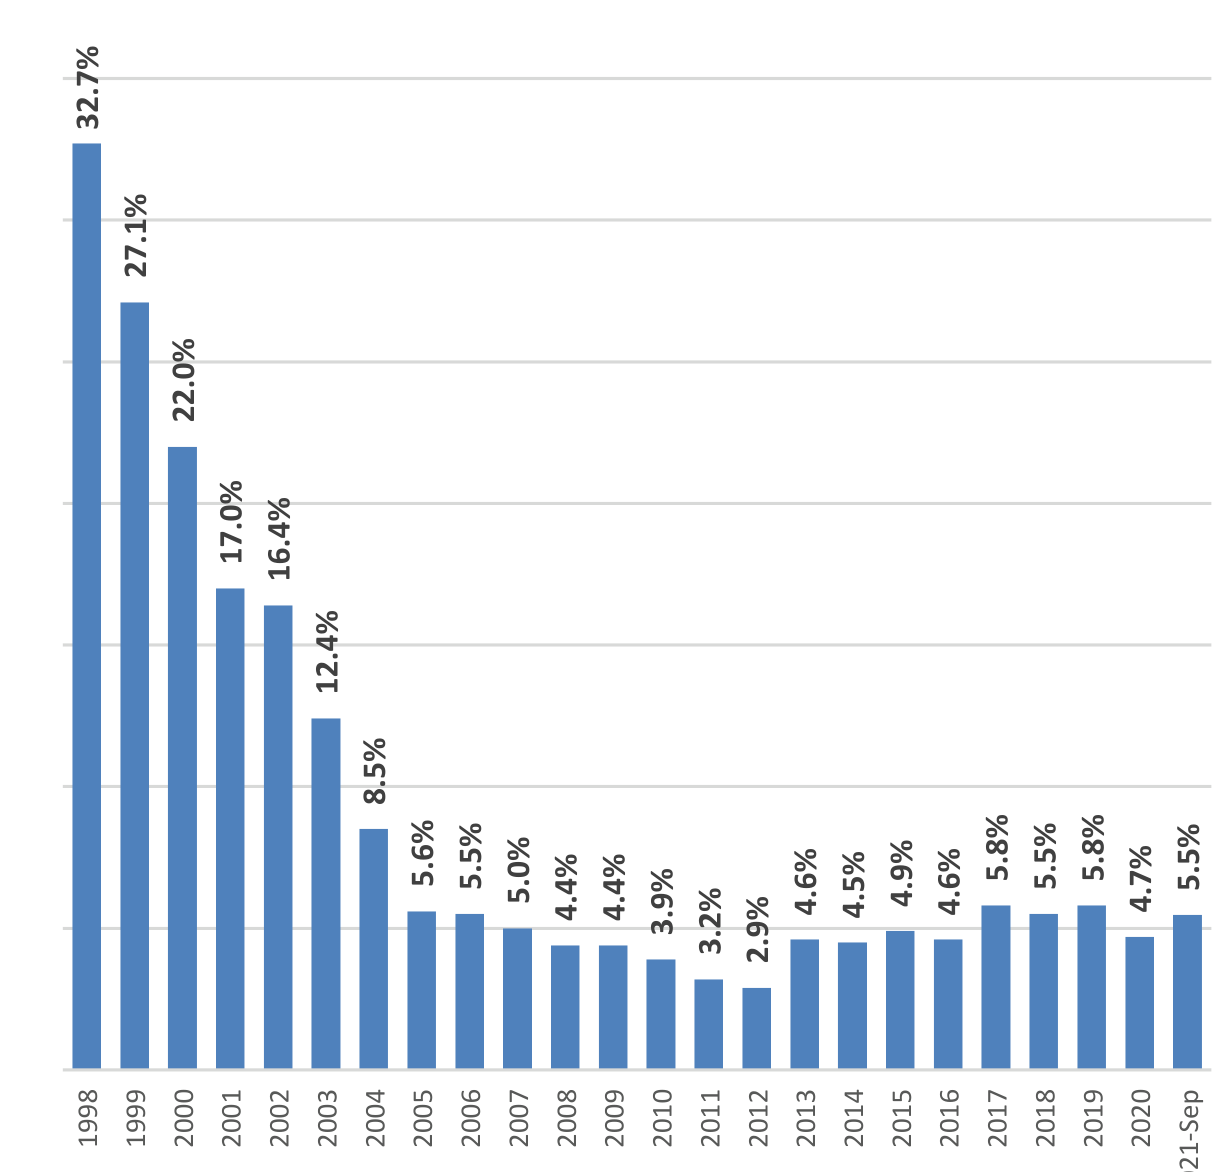 🔍 Tap to enlarge
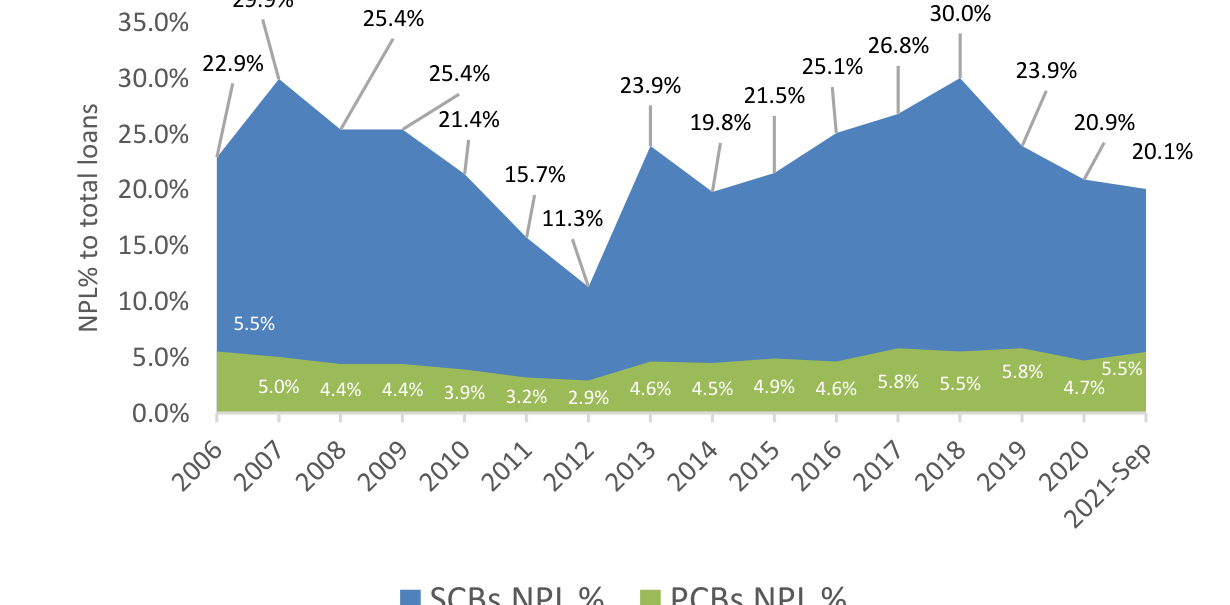 🔍 Tap to enlarge